Cities with the Most Immigrants from Costa Rica in Pennsylvania
RELATED REPORTS & OPTIONS
Costa Rica
Pennsylvania
Compare Cities
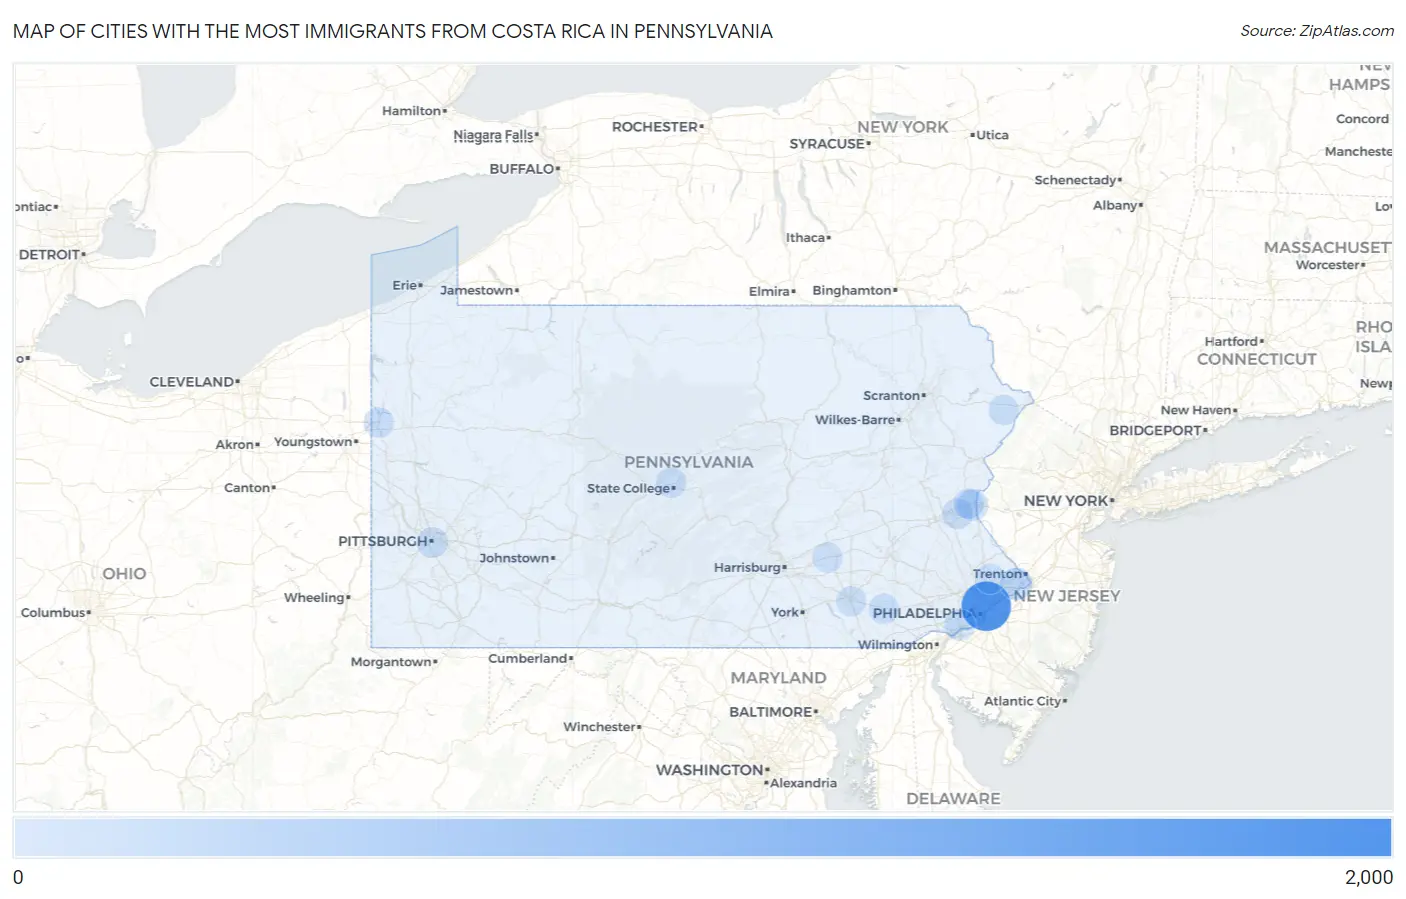
Map of Cities with the Most Immigrants from Costa Rica in Pennsylvania
0
2,000
Cities with the Most Immigrants from Costa Rica in Pennsylvania
| City | Costa Rica | vs State | vs National | |
| 1. | Philadelphia | 1,514 | 3,132(48.34%)#1 | 95,844(1.58%)#2 |
| 2. | Levittown | 143 | 3,132(4.57%)#2 | 95,844(0.15%)#102 |
| 3. | Easton | 95 | 3,132(3.03%)#3 | 95,844(0.10%)#176 |
| 4. | Woodlyn | 80 | 3,132(2.55%)#4 | 95,844(0.08%)#231 |
| 5. | Ambler Borough | 60 | 3,132(1.92%)#5 | 95,844(0.06%)#326 |
| 6. | Pittsburgh | 58 | 3,132(1.85%)#6 | 95,844(0.06%)#337 |
| 7. | Norristown Borough | 51 | 3,132(1.63%)#7 | 95,844(0.05%)#370 |
| 8. | Bethlehem | 45 | 3,132(1.44%)#8 | 95,844(0.05%)#420 |
| 9. | Lewisburg Borough | 43 | 3,132(1.37%)#9 | 95,844(0.04%)#443 |
| 10. | North Wales Borough | 38 | 3,132(1.21%)#10 | 95,844(0.04%)#499 |
| 11. | Chestnut Hill | 34 | 3,132(1.09%)#11 | 95,844(0.04%)#535 |
| 12. | Berwick Borough | 25 | 3,132(0.80%)#12 | 95,844(0.03%)#687 |
| 13. | Toftrees | 24 | 3,132(0.77%)#13 | 95,844(0.03%)#708 |
| 14. | West Chester Borough | 22 | 3,132(0.70%)#14 | 95,844(0.02%)#745 |
| 15. | Folcroft Borough | 21 | 3,132(0.67%)#15 | 95,844(0.02%)#775 |
| 16. | Palmer Heights | 21 | 3,132(0.67%)#16 | 95,844(0.02%)#780 |
| 17. | Penndel Borough | 19 | 3,132(0.61%)#17 | 95,844(0.02%)#823 |
| 18. | West Kittanning Borough | 19 | 3,132(0.61%)#18 | 95,844(0.02%)#825 |
| 19. | Hermitage | 14 | 3,132(0.45%)#19 | 95,844(0.01%)#962 |
| 20. | Gap | 14 | 3,132(0.45%)#20 | 95,844(0.01%)#971 |
| 21. | Ridley Park Borough | 13 | 3,132(0.42%)#21 | 95,844(0.01%)#1,004 |
| 22. | Sunrise Lake | 13 | 3,132(0.42%)#22 | 95,844(0.01%)#1,013 |
| 23. | Morrisville Borough | 12 | 3,132(0.38%)#23 | 95,844(0.01%)#1,046 |
| 24. | Fox Chapel Borough | 11 | 3,132(0.35%)#24 | 95,844(0.01%)#1,101 |
| 25. | Annville | 11 | 3,132(0.35%)#25 | 95,844(0.01%)#1,102 |
| 26. | Warminster Heights | 11 | 3,132(0.35%)#26 | 95,844(0.01%)#1,104 |
| 27. | Chambersburg Borough | 10 | 3,132(0.32%)#27 | 95,844(0.01%)#1,134 |
| 28. | Lancaster | 8 | 3,132(0.26%)#28 | 95,844(0.01%)#1,200 |
| 29. | Souderton Borough | 7 | 3,132(0.22%)#29 | 95,844(0.01%)#1,273 |
| 30. | Marysville Borough | 7 | 3,132(0.22%)#30 | 95,844(0.01%)#1,276 |
| 31. | Palmerton Borough | 6 | 3,132(0.19%)#31 | 95,844(0.01%)#1,306 |
| 32. | Forest City Borough | 6 | 3,132(0.19%)#32 | 95,844(0.01%)#1,319 |
| 33. | Loganville Borough | 6 | 3,132(0.19%)#33 | 95,844(0.01%)#1,320 |
| 34. | Thornburg Borough | 3 | 3,132(0.10%)#34 | 95,844(0.00%)#1,408 |
| 35. | Sewickley Hills Borough | 2 | 3,132(0.06%)#35 | 95,844(0.00%)#1,425 |
Common Questions
What are the Top 10 Cities with the Most Immigrants from Costa Rica in Pennsylvania?
Top 10 Cities with the Most Immigrants from Costa Rica in Pennsylvania are:
#1
1,514
#2
143
#3
95
#4
80
#5
58
#6
45
#7
24
#8
21
#9
14
#10
14
What city has the Most Immigrants from Costa Rica in Pennsylvania?
Philadelphia has the Most Immigrants from Costa Rica in Pennsylvania with 1,514.
What is the Total Immigrants from Costa Rica in the State of Pennsylvania?
Total Immigrants from Costa Rica in Pennsylvania is 3,132.
What is the Total Immigrants from Costa Rica in the United States?
Total Immigrants from Costa Rica in the United States is 95,844.