Cities with the Most Immigrants from Asia in Kansas
RELATED REPORTS & OPTIONS
Asia
Kansas
Compare Cities
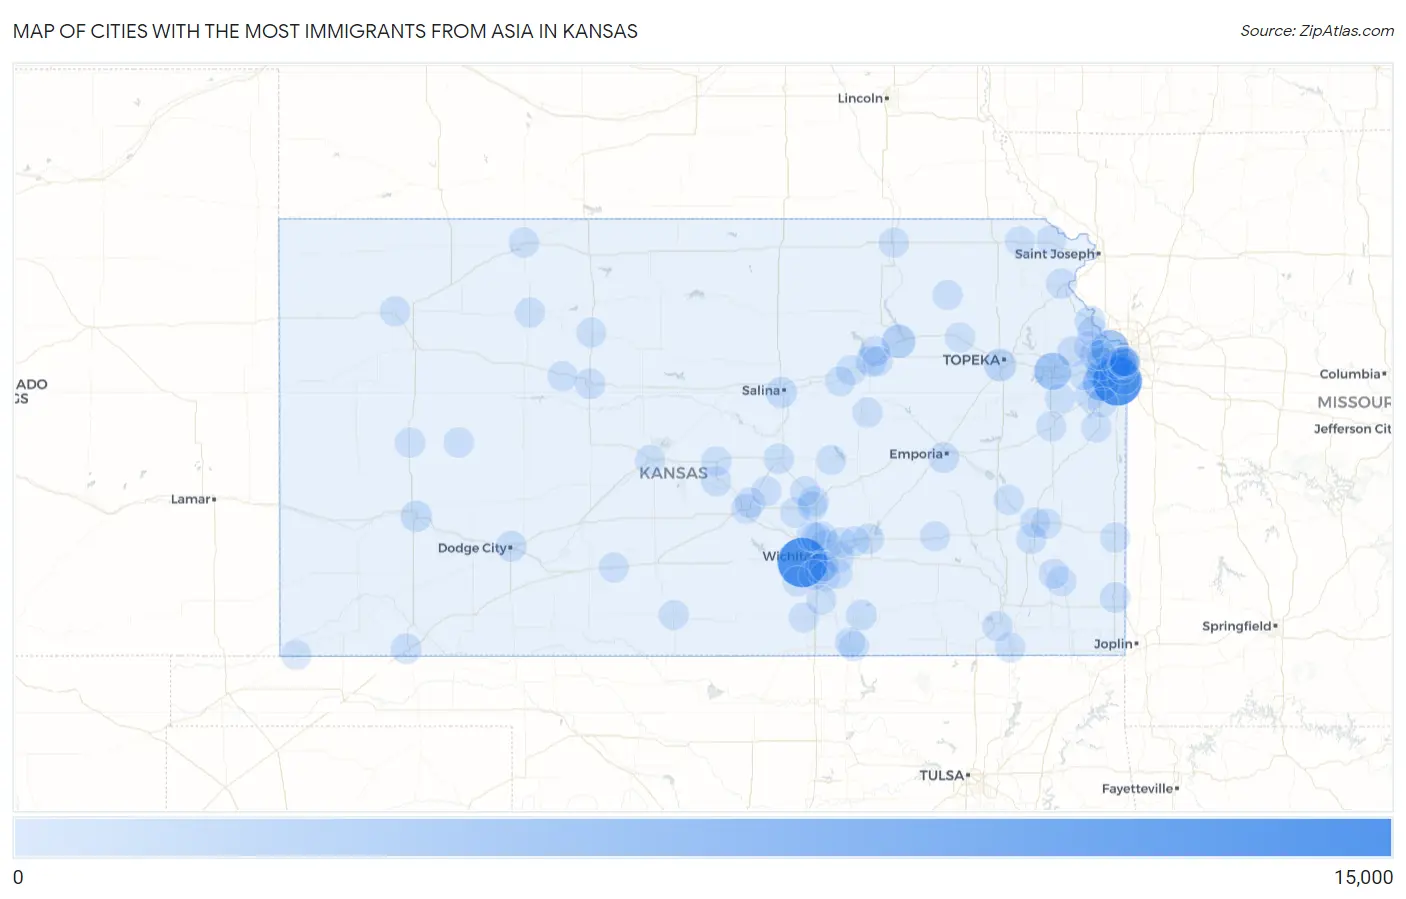
Map of Cities with the Most Immigrants from Asia in Kansas
0
15,000
Cities with the Most Immigrants from Asia in Kansas
| City | Asia | vs State | vs National | |
| 1. | Wichita | 14,347 | 65,722(21.83%)#1 | 14,105,933(0.10%)#134 |
| 2. | Overland Park | 13,569 | 65,722(20.65%)#2 | 14,105,933(0.10%)#144 |
| 3. | Kansas City | 5,158 | 65,722(7.85%)#3 | 14,105,933(0.04%)#412 |
| 4. | Lawrence | 4,814 | 65,722(7.32%)#4 | 14,105,933(0.03%)#450 |
| 5. | Olathe | 4,540 | 65,722(6.91%)#5 | 14,105,933(0.03%)#475 |
| 6. | Manhattan | 2,272 | 65,722(3.46%)#6 | 14,105,933(0.02%)#868 |
| 7. | Shawnee | 1,703 | 65,722(2.59%)#7 | 14,105,933(0.01%)#1,105 |
| 8. | Topeka | 1,700 | 65,722(2.59%)#8 | 14,105,933(0.01%)#1,107 |
| 9. | Lenexa | 1,449 | 65,722(2.20%)#9 | 14,105,933(0.01%)#1,251 |
| 10. | Leawood | 1,378 | 65,722(2.10%)#10 | 14,105,933(0.01%)#1,297 |
| 11. | Garden City | 816 | 65,722(1.24%)#11 | 14,105,933(0.01%)#1,837 |
| 12. | Salina | 721 | 65,722(1.10%)#12 | 14,105,933(0.01%)#1,970 |
| 13. | Bel Aire | 479 | 65,722(0.73%)#13 | 14,105,933(0.00%)#2,507 |
| 14. | Junction City | 477 | 65,722(0.73%)#14 | 14,105,933(0.00%)#2,511 |
| 15. | Mission | 451 | 65,722(0.69%)#15 | 14,105,933(0.00%)#2,601 |
| 16. | Leavenworth | 450 | 65,722(0.68%)#16 | 14,105,933(0.00%)#2,606 |
| 17. | Emporia | 444 | 65,722(0.68%)#17 | 14,105,933(0.00%)#2,629 |
| 18. | Andover | 389 | 65,722(0.59%)#18 | 14,105,933(0.00%)#2,816 |
| 19. | Winfield | 377 | 65,722(0.57%)#19 | 14,105,933(0.00%)#2,876 |
| 20. | Dodge City | 373 | 65,722(0.57%)#20 | 14,105,933(0.00%)#2,896 |
| 21. | Bonner Springs | 357 | 65,722(0.54%)#21 | 14,105,933(0.00%)#2,963 |
| 22. | Liberal | 332 | 65,722(0.51%)#22 | 14,105,933(0.00%)#3,093 |
| 23. | Pittsburg | 328 | 65,722(0.50%)#23 | 14,105,933(0.00%)#3,109 |
| 24. | Merriam | 305 | 65,722(0.46%)#24 | 14,105,933(0.00%)#3,233 |
| 25. | Hays | 301 | 65,722(0.46%)#25 | 14,105,933(0.00%)#3,262 |
| 26. | Gardner | 287 | 65,722(0.44%)#26 | 14,105,933(0.00%)#3,339 |
| 27. | Prairie Village | 261 | 65,722(0.40%)#27 | 14,105,933(0.00%)#3,472 |
| 28. | Tonganoxie | 235 | 65,722(0.36%)#28 | 14,105,933(0.00%)#3,679 |
| 29. | Oaklawn Sunview | 233 | 65,722(0.35%)#29 | 14,105,933(0.00%)#3,697 |
| 30. | Hutchinson | 220 | 65,722(0.33%)#30 | 14,105,933(0.00%)#3,780 |
| 31. | Derby | 215 | 65,722(0.33%)#31 | 14,105,933(0.00%)#3,834 |
| 32. | El Dorado | 186 | 65,722(0.28%)#32 | 14,105,933(0.00%)#4,099 |
| 33. | Mcpherson | 172 | 65,722(0.26%)#33 | 14,105,933(0.00%)#4,246 |
| 34. | Fort Riley | 162 | 65,722(0.25%)#34 | 14,105,933(0.00%)#4,358 |
| 35. | Roeland Park | 144 | 65,722(0.22%)#35 | 14,105,933(0.00%)#4,606 |
| 36. | Atchison | 139 | 65,722(0.21%)#36 | 14,105,933(0.00%)#4,669 |
| 37. | North Newton | 132 | 65,722(0.20%)#37 | 14,105,933(0.00%)#4,800 |
| 38. | Mission Hills | 126 | 65,722(0.19%)#38 | 14,105,933(0.00%)#4,893 |
| 39. | Fairway | 124 | 65,722(0.19%)#39 | 14,105,933(0.00%)#4,927 |
| 40. | Basehor | 107 | 65,722(0.16%)#40 | 14,105,933(0.00%)#5,203 |
| 41. | De Soto | 105 | 65,722(0.16%)#41 | 14,105,933(0.00%)#5,226 |
| 42. | Lansing | 104 | 65,722(0.16%)#42 | 14,105,933(0.00%)#5,243 |
| 43. | Kechi | 99 | 65,722(0.15%)#43 | 14,105,933(0.00%)#5,351 |
| 44. | Baldwin City | 95 | 65,722(0.14%)#44 | 14,105,933(0.00%)#5,421 |
| 45. | Grandview Plaza | 89 | 65,722(0.14%)#45 | 14,105,933(0.00%)#5,571 |
| 46. | Edwardsville | 87 | 65,722(0.13%)#46 | 14,105,933(0.00%)#5,608 |
| 47. | Park City | 85 | 65,722(0.13%)#47 | 14,105,933(0.00%)#5,636 |
| 48. | Paola | 77 | 65,722(0.12%)#48 | 14,105,933(0.00%)#5,851 |
| 49. | Parkerfield | 63 | 65,722(0.10%)#49 | 14,105,933(0.00%)#6,304 |
| 50. | Valley Center | 57 | 65,722(0.09%)#50 | 14,105,933(0.00%)#6,493 |
| 51. | Herington | 56 | 65,722(0.09%)#51 | 14,105,933(0.00%)#6,555 |
| 52. | Clearwater | 53 | 65,722(0.08%)#52 | 14,105,933(0.00%)#6,669 |
| 53. | Marysville | 50 | 65,722(0.08%)#53 | 14,105,933(0.00%)#6,794 |
| 54. | Haviland | 46 | 65,722(0.07%)#54 | 14,105,933(0.00%)#6,999 |
| 55. | Scott City | 43 | 65,722(0.07%)#55 | 14,105,933(0.00%)#7,136 |
| 56. | Coffeyville | 42 | 65,722(0.06%)#56 | 14,105,933(0.00%)#7,176 |
| 57. | Benton | 42 | 65,722(0.06%)#57 | 14,105,933(0.00%)#7,220 |
| 58. | Halstead | 41 | 65,722(0.06%)#58 | 14,105,933(0.00%)#7,254 |
| 59. | Dighton | 40 | 65,722(0.06%)#59 | 14,105,933(0.00%)#7,338 |
| 60. | Rose Hill | 39 | 65,722(0.06%)#60 | 14,105,933(0.00%)#7,358 |
| 61. | Great Bend | 37 | 65,722(0.06%)#61 | 14,105,933(0.00%)#7,458 |
| 62. | Keats | 37 | 65,722(0.06%)#62 | 14,105,933(0.00%)#7,520 |
| 63. | Chapman | 35 | 65,722(0.05%)#63 | 14,105,933(0.00%)#7,633 |
| 64. | South Hutchinson | 33 | 65,722(0.05%)#64 | 14,105,933(0.00%)#7,760 |
| 65. | Ottawa | 32 | 65,722(0.05%)#65 | 14,105,933(0.00%)#7,793 |
| 66. | Hillsboro | 32 | 65,722(0.05%)#66 | 14,105,933(0.00%)#7,824 |
| 67. | Iola | 29 | 65,722(0.04%)#67 | 14,105,933(0.00%)#8,043 |
| 68. | Newton | 28 | 65,722(0.04%)#68 | 14,105,933(0.00%)#8,121 |
| 69. | St Marys | 28 | 65,722(0.04%)#69 | 14,105,933(0.00%)#8,165 |
| 70. | Wellington | 27 | 65,722(0.04%)#70 | 14,105,933(0.00%)#8,209 |
| 71. | Sterling | 26 | 65,722(0.04%)#71 | 14,105,933(0.00%)#8,328 |
| 72. | Humboldt | 26 | 65,722(0.04%)#72 | 14,105,933(0.00%)#8,335 |
| 73. | Westwood | 26 | 65,722(0.04%)#73 | 14,105,933(0.00%)#8,339 |
| 74. | Elkhart | 26 | 65,722(0.04%)#74 | 14,105,933(0.00%)#8,343 |
| 75. | Norton | 25 | 65,722(0.04%)#75 | 14,105,933(0.00%)#8,429 |
| 76. | St Paul | 25 | 65,722(0.04%)#76 | 14,105,933(0.00%)#8,468 |
| 77. | Fort Scott | 24 | 65,722(0.04%)#77 | 14,105,933(0.00%)#8,486 |
| 78. | Belle Plaine | 24 | 65,722(0.04%)#78 | 14,105,933(0.00%)#8,564 |
| 79. | Spring Hill | 23 | 65,722(0.03%)#79 | 14,105,933(0.00%)#8,603 |
| 80. | Hesston | 23 | 65,722(0.03%)#80 | 14,105,933(0.00%)#8,634 |
| 81. | Colby | 21 | 65,722(0.03%)#81 | 14,105,933(0.00%)#8,839 |
| 82. | Ellis | 21 | 65,722(0.03%)#82 | 14,105,933(0.00%)#8,888 |
| 83. | Onaga | 21 | 65,722(0.03%)#83 | 14,105,933(0.00%)#8,935 |
| 84. | Hiawatha | 20 | 65,722(0.03%)#84 | 14,105,933(0.00%)#8,978 |
| 85. | Haysville | 19 | 65,722(0.03%)#85 | 14,105,933(0.00%)#9,051 |
| 86. | Enterprise | 19 | 65,722(0.03%)#86 | 14,105,933(0.00%)#9,143 |
| 87. | Lyons | 18 | 65,722(0.03%)#87 | 14,105,933(0.00%)#9,201 |
| 88. | Hill City | 18 | 65,722(0.03%)#88 | 14,105,933(0.00%)#9,248 |
| 89. | Leroy | 18 | 65,722(0.03%)#89 | 14,105,933(0.00%)#9,289 |
| 90. | Medicine Lodge | 17 | 65,722(0.03%)#90 | 14,105,933(0.00%)#9,413 |
| 91. | La Harpe | 17 | 65,722(0.03%)#91 | 14,105,933(0.00%)#9,443 |
| 92. | Independence | 16 | 65,722(0.02%)#92 | 14,105,933(0.00%)#9,466 |
| 93. | Eureka | 16 | 65,722(0.02%)#93 | 14,105,933(0.00%)#9,508 |
| 94. | Mcconnell Afb | 15 | 65,722(0.02%)#94 | 14,105,933(0.00%)#9,658 |
| 95. | Plainville | 15 | 65,722(0.02%)#95 | 14,105,933(0.00%)#9,663 |
| 96. | Erie | 15 | 65,722(0.02%)#96 | 14,105,933(0.00%)#9,675 |
| 97. | Arkansas City | 14 | 65,722(0.02%)#97 | 14,105,933(0.00%)#9,736 |
| 98. | Towanda | 14 | 65,722(0.02%)#98 | 14,105,933(0.00%)#9,822 |
| 99. | Highland | 14 | 65,722(0.02%)#99 | 14,105,933(0.00%)#9,848 |
| 100. | Buhler | 13 | 65,722(0.02%)#100 | 14,105,933(0.00%)#9,995 |
Common Questions
What are the Top 10 Cities with the Most Immigrants from Asia in Kansas?
Top 10 Cities with the Most Immigrants from Asia in Kansas are:
#1
14,347
#2
13,569
#3
5,158
#4
4,814
#5
4,540
#6
2,272
#7
1,703
#8
1,700
#9
1,449
#10
1,378
What city has the Most Immigrants from Asia in Kansas?
Wichita has the Most Immigrants from Asia in Kansas with 14,347.
What is the Total Immigrants from Asia in the State of Kansas?
Total Immigrants from Asia in Kansas is 65,722.
What is the Total Immigrants from Asia in the United States?
Total Immigrants from Asia in the United States is 14,105,933.