Cities with the Most Immigrants from Asia in Kentucky
RELATED REPORTS & OPTIONS
Asia
Kentucky
Compare Cities
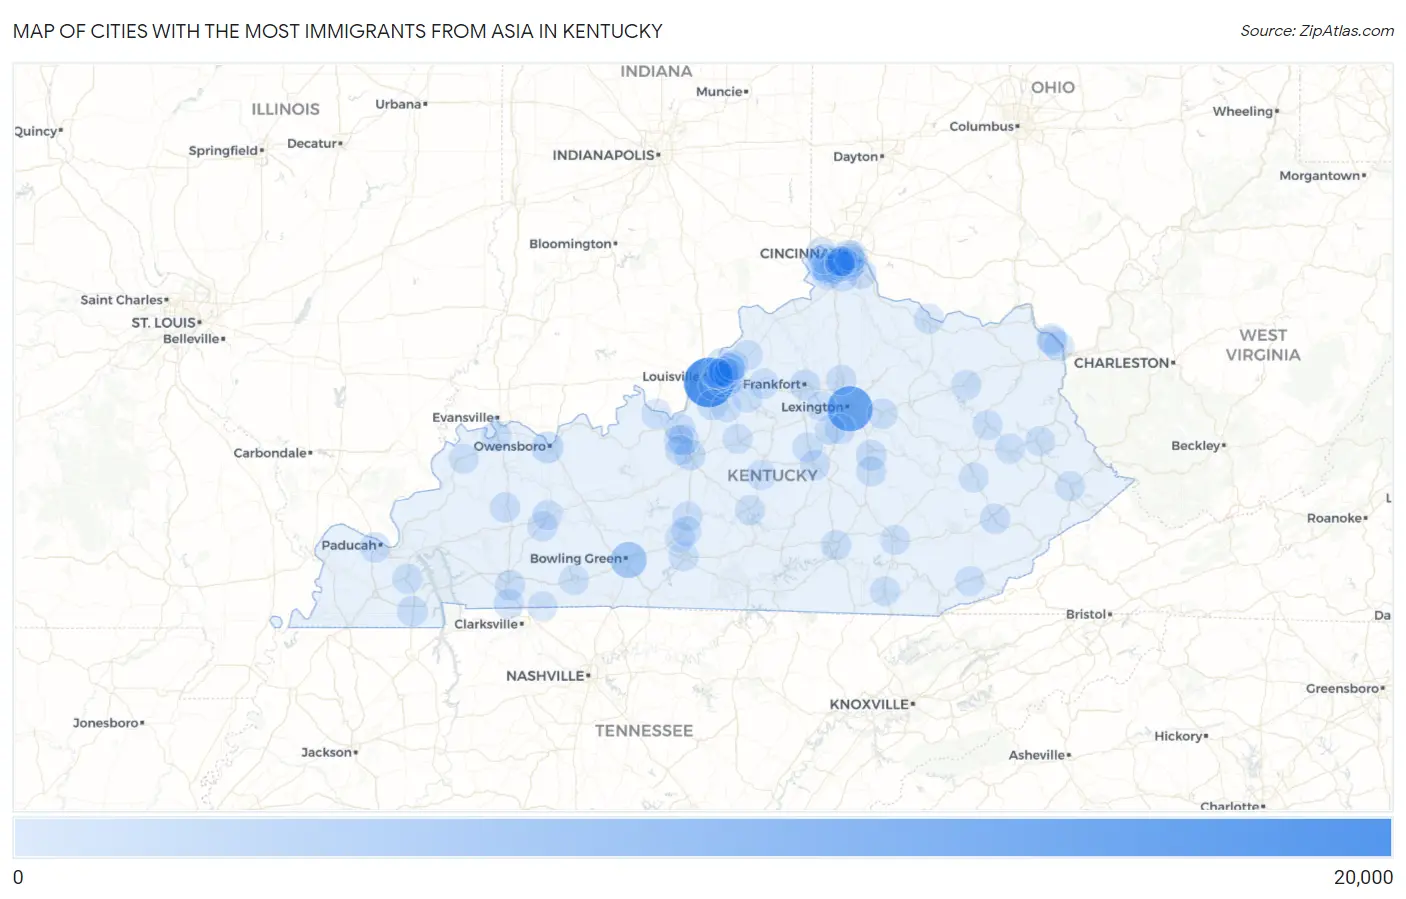
Map of Cities with the Most Immigrants from Asia in Kentucky
0
20,000
Cities with the Most Immigrants from Asia in Kentucky
| City | Asia | vs State | vs National | |
| 1. | Louisville | 15,928 | 61,698(25.82%)#1 | 14,105,933(0.11%)#116 |
| 2. | Lexington | 12,244 | 61,698(19.85%)#2 | 14,105,933(0.09%)#167 |
| 3. | Bowling Green | 4,755 | 61,698(7.71%)#3 | 14,105,933(0.03%)#456 |
| 4. | Owensboro | 1,404 | 61,698(2.28%)#4 | 14,105,933(0.01%)#1,282 |
| 5. | Jeffersontown | 1,218 | 61,698(1.97%)#5 | 14,105,933(0.01%)#1,405 |
| 6. | Florence | 866 | 61,698(1.40%)#6 | 14,105,933(0.01%)#1,772 |
| 7. | Hurstbourne Acres | 811 | 61,698(1.31%)#7 | 14,105,933(0.01%)#1,850 |
| 8. | Hurstbourne | 786 | 61,698(1.27%)#8 | 14,105,933(0.01%)#1,884 |
| 9. | Elizabethtown | 664 | 61,698(1.08%)#9 | 14,105,933(0.00%)#2,067 |
| 10. | Frankfort | 621 | 61,698(1.01%)#10 | 14,105,933(0.00%)#2,159 |
| 11. | Middletown | 596 | 61,698(0.97%)#11 | 14,105,933(0.00%)#2,216 |
| 12. | Radcliff | 584 | 61,698(0.95%)#12 | 14,105,933(0.00%)#2,241 |
| 13. | Richmond | 493 | 61,698(0.80%)#13 | 14,105,933(0.00%)#2,460 |
| 14. | St Matthews | 476 | 61,698(0.77%)#14 | 14,105,933(0.00%)#2,513 |
| 15. | Independence | 458 | 61,698(0.74%)#15 | 14,105,933(0.00%)#2,583 |
| 16. | Murray | 457 | 61,698(0.74%)#16 | 14,105,933(0.00%)#2,587 |
| 17. | Burlington | 417 | 61,698(0.68%)#17 | 14,105,933(0.00%)#2,718 |
| 18. | West Buechel | 360 | 61,698(0.58%)#18 | 14,105,933(0.00%)#2,951 |
| 19. | Covington | 351 | 61,698(0.57%)#19 | 14,105,933(0.00%)#2,991 |
| 20. | Hopkinsville | 350 | 61,698(0.57%)#20 | 14,105,933(0.00%)#2,998 |
| 21. | Hillview | 342 | 61,698(0.55%)#21 | 14,105,933(0.00%)#3,038 |
| 22. | Greenville | 336 | 61,698(0.54%)#22 | 14,105,933(0.00%)#3,067 |
| 23. | Erlanger | 313 | 61,698(0.51%)#23 | 14,105,933(0.00%)#3,187 |
| 24. | Meadow Vale | 298 | 61,698(0.48%)#24 | 14,105,933(0.00%)#3,285 |
| 25. | Alexandria | 278 | 61,698(0.45%)#25 | 14,105,933(0.00%)#3,394 |
| 26. | Crescent Springs | 253 | 61,698(0.41%)#26 | 14,105,933(0.00%)#3,532 |
| 27. | Nicholasville | 252 | 61,698(0.41%)#27 | 14,105,933(0.00%)#3,533 |
| 28. | Madisonville | 249 | 61,698(0.40%)#28 | 14,105,933(0.00%)#3,563 |
| 29. | Georgetown | 237 | 61,698(0.38%)#29 | 14,105,933(0.00%)#3,657 |
| 30. | Fort Campbell North | 227 | 61,698(0.37%)#30 | 14,105,933(0.00%)#3,733 |
| 31. | Lyndon | 224 | 61,698(0.36%)#31 | 14,105,933(0.00%)#3,750 |
| 32. | Elsmere | 218 | 61,698(0.35%)#32 | 14,105,933(0.00%)#3,807 |
| 33. | Highland Heights | 218 | 61,698(0.35%)#33 | 14,105,933(0.00%)#3,810 |
| 34. | Fort Thomas | 216 | 61,698(0.35%)#34 | 14,105,933(0.00%)#3,823 |
| 35. | Winchester | 199 | 61,698(0.32%)#35 | 14,105,933(0.00%)#3,976 |
| 36. | Danville | 193 | 61,698(0.31%)#36 | 14,105,933(0.00%)#4,035 |
| 37. | Paducah | 187 | 61,698(0.30%)#37 | 14,105,933(0.00%)#4,084 |
| 38. | Francisville | 185 | 61,698(0.30%)#38 | 14,105,933(0.00%)#4,112 |
| 39. | Benton | 177 | 61,698(0.29%)#39 | 14,105,933(0.00%)#4,197 |
| 40. | Shelbyville | 174 | 61,698(0.28%)#40 | 14,105,933(0.00%)#4,227 |
| 41. | Prospect | 174 | 61,698(0.28%)#41 | 14,105,933(0.00%)#4,233 |
| 42. | Oakbrook | 163 | 61,698(0.26%)#42 | 14,105,933(0.00%)#4,346 |
| 43. | Henderson | 157 | 61,698(0.25%)#43 | 14,105,933(0.00%)#4,430 |
| 44. | Berea | 146 | 61,698(0.24%)#44 | 14,105,933(0.00%)#4,574 |
| 45. | Somerset | 146 | 61,698(0.24%)#45 | 14,105,933(0.00%)#4,576 |
| 46. | Fort Knox | 146 | 61,698(0.24%)#46 | 14,105,933(0.00%)#4,578 |
| 47. | Beechwood Village | 145 | 61,698(0.24%)#47 | 14,105,933(0.00%)#4,594 |
| 48. | Ashland | 134 | 61,698(0.22%)#48 | 14,105,933(0.00%)#4,753 |
| 49. | Hazard | 134 | 61,698(0.22%)#49 | 14,105,933(0.00%)#4,765 |
| 50. | Glasgow | 131 | 61,698(0.21%)#50 | 14,105,933(0.00%)#4,803 |
| 51. | Taylor Mill | 124 | 61,698(0.20%)#51 | 14,105,933(0.00%)#4,921 |
| 52. | Bardstown | 118 | 61,698(0.19%)#52 | 14,105,933(0.00%)#4,998 |
| 53. | Harrodsburg | 115 | 61,698(0.19%)#53 | 14,105,933(0.00%)#5,060 |
| 54. | Indian Hills | 113 | 61,698(0.18%)#54 | 14,105,933(0.00%)#5,096 |
| 55. | Vine Grove | 109 | 61,698(0.18%)#55 | 14,105,933(0.00%)#5,167 |
| 56. | Pikeville | 101 | 61,698(0.16%)#56 | 14,105,933(0.00%)#5,298 |
| 57. | Brandenburg | 96 | 61,698(0.16%)#57 | 14,105,933(0.00%)#5,399 |
| 58. | Russell | 93 | 61,698(0.15%)#58 | 14,105,933(0.00%)#5,469 |
| 59. | La Grange | 92 | 61,698(0.15%)#59 | 14,105,933(0.00%)#5,489 |
| 60. | Campbellsville | 91 | 61,698(0.15%)#60 | 14,105,933(0.00%)#5,515 |
| 61. | Morehead | 91 | 61,698(0.15%)#61 | 14,105,933(0.00%)#5,523 |
| 62. | Union | 87 | 61,698(0.14%)#62 | 14,105,933(0.00%)#5,602 |
| 63. | Williamsburg | 83 | 61,698(0.13%)#63 | 14,105,933(0.00%)#5,690 |
| 64. | Worthington Hills | 83 | 61,698(0.13%)#64 | 14,105,933(0.00%)#5,696 |
| 65. | Coldstream | 77 | 61,698(0.12%)#65 | 14,105,933(0.00%)#5,872 |
| 66. | Edgewood | 74 | 61,698(0.12%)#66 | 14,105,933(0.00%)#5,934 |
| 67. | Lakeside Park | 74 | 61,698(0.12%)#67 | 14,105,933(0.00%)#5,957 |
| 68. | West Liberty | 72 | 61,698(0.12%)#68 | 14,105,933(0.00%)#6,006 |
| 69. | Bellefonte | 71 | 61,698(0.12%)#69 | 14,105,933(0.00%)#6,041 |
| 70. | Lebanon | 65 | 61,698(0.11%)#70 | 14,105,933(0.00%)#6,220 |
| 71. | Mount Washington | 60 | 61,698(0.10%)#71 | 14,105,933(0.00%)#6,375 |
| 72. | Hebron | 59 | 61,698(0.10%)#72 | 14,105,933(0.00%)#6,423 |
| 73. | Newport | 58 | 61,698(0.09%)#73 | 14,105,933(0.00%)#6,449 |
| 74. | Wallins Creek | 58 | 61,698(0.09%)#74 | 14,105,933(0.00%)#6,482 |
| 75. | Plantation | 56 | 61,698(0.09%)#75 | 14,105,933(0.00%)#6,556 |
| 76. | Paintsville | 55 | 61,698(0.09%)#76 | 14,105,933(0.00%)#6,579 |
| 77. | Rineyville | 53 | 61,698(0.09%)#77 | 14,105,933(0.00%)#6,664 |
| 78. | Langdon Place | 53 | 61,698(0.09%)#78 | 14,105,933(0.00%)#6,683 |
| 79. | Anchorage | 52 | 61,698(0.08%)#79 | 14,105,933(0.00%)#6,717 |
| 80. | Central City | 51 | 61,698(0.08%)#80 | 14,105,933(0.00%)#6,744 |
| 81. | Cave City | 50 | 61,698(0.08%)#81 | 14,105,933(0.00%)#6,802 |
| 82. | London | 48 | 61,698(0.08%)#82 | 14,105,933(0.00%)#6,880 |
| 83. | Wilmore | 48 | 61,698(0.08%)#83 | 14,105,933(0.00%)#6,885 |
| 84. | Southgate | 48 | 61,698(0.08%)#84 | 14,105,933(0.00%)#6,891 |
| 85. | Graymoor Devondale | 48 | 61,698(0.08%)#85 | 14,105,933(0.00%)#6,895 |
| 86. | Salyersville | 48 | 61,698(0.08%)#86 | 14,105,933(0.00%)#6,904 |
| 87. | Crestview Hills | 46 | 61,698(0.07%)#87 | 14,105,933(0.00%)#6,979 |
| 88. | Breckinridge Center | 45 | 61,698(0.07%)#88 | 14,105,933(0.00%)#7,042 |
| 89. | Versailles | 41 | 61,698(0.07%)#89 | 14,105,933(0.00%)#7,224 |
| 90. | Jackson | 41 | 61,698(0.07%)#90 | 14,105,933(0.00%)#7,253 |
| 91. | Munfordville | 41 | 61,698(0.07%)#91 | 14,105,933(0.00%)#7,258 |
| 92. | Fort Mitchell | 40 | 61,698(0.06%)#92 | 14,105,933(0.00%)#7,286 |
| 93. | Russellville | 40 | 61,698(0.06%)#93 | 14,105,933(0.00%)#7,291 |
| 94. | Crestwood | 38 | 61,698(0.06%)#94 | 14,105,933(0.00%)#7,409 |
| 95. | Elk Creek | 36 | 61,698(0.06%)#95 | 14,105,933(0.00%)#7,559 |
| 96. | Horse Cave | 35 | 61,698(0.06%)#96 | 14,105,933(0.00%)#7,615 |
| 97. | Windy Hills | 35 | 61,698(0.06%)#97 | 14,105,933(0.00%)#7,617 |
| 98. | Guthrie | 34 | 61,698(0.06%)#98 | 14,105,933(0.00%)#7,694 |
| 99. | Maysville | 33 | 61,698(0.05%)#99 | 14,105,933(0.00%)#7,722 |
| 100. | Fort Wright | 32 | 61,698(0.05%)#100 | 14,105,933(0.00%)#7,803 |
Common Questions
What are the Top 10 Cities with the Most Immigrants from Asia in Kentucky?
Top 10 Cities with the Most Immigrants from Asia in Kentucky are:
#1
15,928
#2
12,244
#3
4,755
#4
1,404
#5
1,218
#6
866
#7
811
#8
786
#9
664
#10
621
What city has the Most Immigrants from Asia in Kentucky?
Louisville has the Most Immigrants from Asia in Kentucky with 15,928.
What is the Total Immigrants from Asia in the State of Kentucky?
Total Immigrants from Asia in Kentucky is 61,698.
What is the Total Immigrants from Asia in the United States?
Total Immigrants from Asia in the United States is 14,105,933.