Cities with the Most Immigrants from Asia in Ohio
RELATED REPORTS & OPTIONS
Asia
Ohio
Compare Cities
Map of Cities with the Most Immigrants from Asia in Ohio
0
50,000
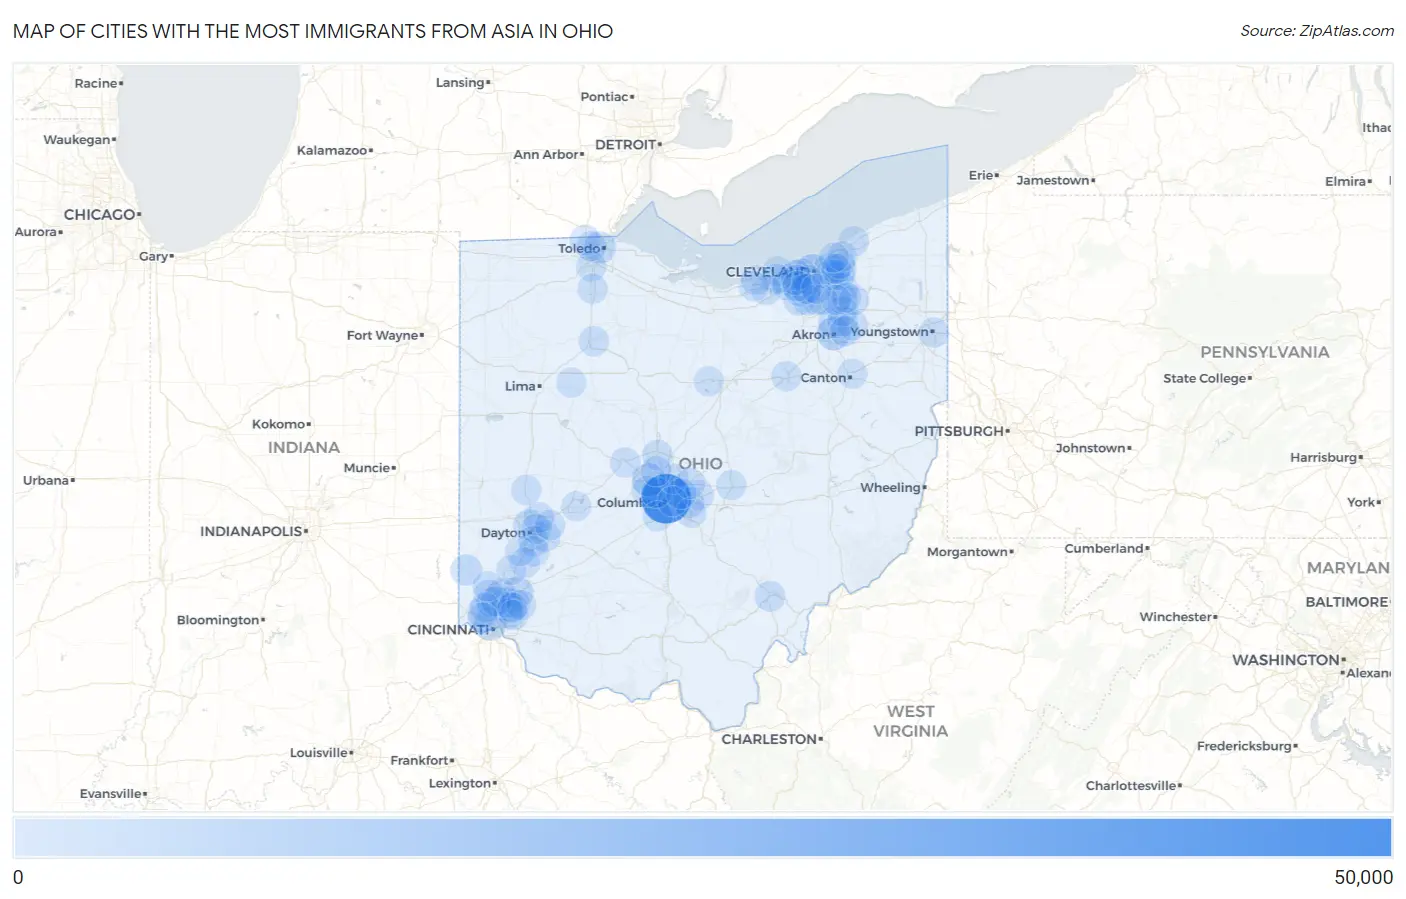
Cities with the Most Immigrants from Asia in Ohio
| City | Asia | vs State | vs National | |
| 1. | Columbus | 43,515 | 242,488(17.95%)#1 | 14,105,933(0.31%)#27 |
| 2. | Cleveland | 9,064 | 242,488(3.74%)#2 | 14,105,933(0.06%)#220 |
| 3. | Dublin | 7,316 | 242,488(3.02%)#3 | 14,105,933(0.05%)#283 |
| 4. | Akron | 6,919 | 242,488(2.85%)#4 | 14,105,933(0.05%)#303 |
| 5. | Cincinnati | 6,262 | 242,488(2.58%)#5 | 14,105,933(0.04%)#336 |
| 6. | Mason | 4,276 | 242,488(1.76%)#6 | 14,105,933(0.03%)#502 |
| 7. | Toledo | 3,696 | 242,488(1.52%)#7 | 14,105,933(0.03%)#573 |
| 8. | Solon | 2,858 | 242,488(1.18%)#8 | 14,105,933(0.02%)#716 |
| 9. | Oxford | 2,544 | 242,488(1.05%)#9 | 14,105,933(0.02%)#796 |
| 10. | Cuyahoga Falls | 2,513 | 242,488(1.04%)#10 | 14,105,933(0.02%)#802 |
| 11. | Hilliard | 2,415 | 242,488(1.00%)#11 | 14,105,933(0.02%)#825 |
| 12. | Strongsville | 2,390 | 242,488(0.99%)#12 | 14,105,933(0.02%)#831 |
| 13. | Westlake | 2,379 | 242,488(0.98%)#13 | 14,105,933(0.02%)#834 |
| 14. | Reynoldsburg | 2,088 | 242,488(0.86%)#14 | 14,105,933(0.01%)#935 |
| 15. | Dayton | 2,046 | 242,488(0.84%)#15 | 14,105,933(0.01%)#951 |
| 16. | Cleveland Heights | 1,927 | 242,488(0.79%)#16 | 14,105,933(0.01%)#1,003 |
| 17. | Beavercreek | 1,832 | 242,488(0.76%)#17 | 14,105,933(0.01%)#1,043 |
| 18. | Upper Arlington | 1,799 | 242,488(0.74%)#18 | 14,105,933(0.01%)#1,055 |
| 19. | Parma | 1,785 | 242,488(0.74%)#19 | 14,105,933(0.01%)#1,068 |
| 20. | Mayfield Heights | 1,765 | 242,488(0.73%)#20 | 14,105,933(0.01%)#1,079 |
| 21. | Fairfield | 1,665 | 242,488(0.69%)#21 | 14,105,933(0.01%)#1,131 |
| 22. | Athens | 1,442 | 242,488(0.59%)#22 | 14,105,933(0.01%)#1,257 |
| 23. | Lakewood | 1,367 | 242,488(0.56%)#23 | 14,105,933(0.01%)#1,303 |
| 24. | North Olmsted | 1,367 | 242,488(0.56%)#24 | 14,105,933(0.01%)#1,304 |
| 25. | Huber Heights | 1,364 | 242,488(0.56%)#25 | 14,105,933(0.01%)#1,306 |
| 26. | Delaware | 1,310 | 242,488(0.54%)#26 | 14,105,933(0.01%)#1,338 |
| 27. | Kettering | 1,291 | 242,488(0.53%)#27 | 14,105,933(0.01%)#1,353 |
| 28. | Blue Ash | 1,290 | 242,488(0.53%)#28 | 14,105,933(0.01%)#1,354 |
| 29. | North Royalton | 1,238 | 242,488(0.51%)#29 | 14,105,933(0.01%)#1,383 |
| 30. | Middleburg Heights | 1,231 | 242,488(0.51%)#30 | 14,105,933(0.01%)#1,388 |
| 31. | Stow | 1,185 | 242,488(0.49%)#31 | 14,105,933(0.01%)#1,425 |
| 32. | White Oak | 1,133 | 242,488(0.47%)#32 | 14,105,933(0.01%)#1,466 |
| 33. | Findlay | 1,071 | 242,488(0.44%)#33 | 14,105,933(0.01%)#1,528 |
| 34. | Twinsburg | 1,071 | 242,488(0.44%)#34 | 14,105,933(0.01%)#1,529 |
| 35. | Mentor | 1,066 | 242,488(0.44%)#35 | 14,105,933(0.01%)#1,533 |
| 36. | Beachwood | 1,047 | 242,488(0.43%)#36 | 14,105,933(0.01%)#1,547 |
| 37. | Westerville | 1,010 | 242,488(0.42%)#37 | 14,105,933(0.01%)#1,579 |
| 38. | Troy | 968 | 242,488(0.40%)#38 | 14,105,933(0.01%)#1,632 |
| 39. | Kent | 966 | 242,488(0.40%)#39 | 14,105,933(0.01%)#1,636 |
| 40. | Pataskala | 966 | 242,488(0.40%)#40 | 14,105,933(0.01%)#1,637 |
| 41. | Powell | 955 | 242,488(0.39%)#41 | 14,105,933(0.01%)#1,655 |
| 42. | Pickerington | 923 | 242,488(0.38%)#42 | 14,105,933(0.01%)#1,691 |
| 43. | Centerville | 922 | 242,488(0.38%)#43 | 14,105,933(0.01%)#1,693 |
| 44. | Hudson | 892 | 242,488(0.37%)#44 | 14,105,933(0.01%)#1,737 |
| 45. | Gahanna | 888 | 242,488(0.37%)#45 | 14,105,933(0.01%)#1,739 |
| 46. | Shaker Heights | 848 | 242,488(0.35%)#46 | 14,105,933(0.01%)#1,792 |
| 47. | Riverside | 814 | 242,488(0.34%)#47 | 14,105,933(0.01%)#1,843 |
| 48. | Tallmadge | 803 | 242,488(0.33%)#48 | 14,105,933(0.01%)#1,858 |
| 49. | Brooklyn | 783 | 242,488(0.32%)#49 | 14,105,933(0.01%)#1,888 |
| 50. | Forest Park | 777 | 242,488(0.32%)#50 | 14,105,933(0.01%)#1,898 |
| 51. | Broadview Heights | 740 | 242,488(0.31%)#51 | 14,105,933(0.01%)#1,940 |
| 52. | Sylvania | 731 | 242,488(0.30%)#52 | 14,105,933(0.01%)#1,949 |
| 53. | Pepper Pike | 720 | 242,488(0.30%)#53 | 14,105,933(0.01%)#1,976 |
| 54. | Grove City | 709 | 242,488(0.29%)#54 | 14,105,933(0.01%)#1,995 |
| 55. | Aurora | 697 | 242,488(0.29%)#55 | 14,105,933(0.00%)#2,014 |
| 56. | New Albany | 697 | 242,488(0.29%)#56 | 14,105,933(0.00%)#2,015 |
| 57. | Sharonville | 680 | 242,488(0.28%)#57 | 14,105,933(0.00%)#2,040 |
| 58. | Rocky River | 679 | 242,488(0.28%)#58 | 14,105,933(0.00%)#2,043 |
| 59. | Perrysburg | 666 | 242,488(0.27%)#59 | 14,105,933(0.00%)#2,065 |
| 60. | Sixteen Mile Stand | 645 | 242,488(0.27%)#60 | 14,105,933(0.00%)#2,110 |
| 61. | Beckett Ridge | 638 | 242,488(0.26%)#61 | 14,105,933(0.00%)#2,121 |
| 62. | Fairborn | 632 | 242,488(0.26%)#62 | 14,105,933(0.00%)#2,136 |
| 63. | Avon Lake | 628 | 242,488(0.26%)#63 | 14,105,933(0.00%)#2,146 |
| 64. | Marysville | 622 | 242,488(0.26%)#64 | 14,105,933(0.00%)#2,158 |
| 65. | Brecksville | 617 | 242,488(0.25%)#65 | 14,105,933(0.00%)#2,166 |
| 66. | Kenwood | 595 | 242,488(0.25%)#66 | 14,105,933(0.00%)#2,219 |
| 67. | Parma Heights | 575 | 242,488(0.24%)#67 | 14,105,933(0.00%)#2,266 |
| 68. | Reminderville | 561 | 242,488(0.23%)#68 | 14,105,933(0.00%)#2,301 |
| 69. | Wooster | 543 | 242,488(0.22%)#69 | 14,105,933(0.00%)#2,336 |
| 70. | Fairview Park | 541 | 242,488(0.22%)#70 | 14,105,933(0.00%)#2,341 |
| 71. | Avon | 536 | 242,488(0.22%)#71 | 14,105,933(0.00%)#2,352 |
| 72. | Brook Park | 533 | 242,488(0.22%)#72 | 14,105,933(0.00%)#2,359 |
| 73. | Newark | 525 | 242,488(0.22%)#73 | 14,105,933(0.00%)#2,373 |
| 74. | Highland Heights | 521 | 242,488(0.21%)#74 | 14,105,933(0.00%)#2,384 |
| 75. | Seven Hills | 447 | 242,488(0.18%)#75 | 14,105,933(0.00%)#2,618 |
| 76. | Springboro | 445 | 242,488(0.18%)#76 | 14,105,933(0.00%)#2,624 |
| 77. | Willoughby Hills | 445 | 242,488(0.18%)#77 | 14,105,933(0.00%)#2,626 |
| 78. | Springdale | 440 | 242,488(0.18%)#78 | 14,105,933(0.00%)#2,639 |
| 79. | Bowling Green | 429 | 242,488(0.18%)#79 | 14,105,933(0.00%)#2,673 |
| 80. | Northbrook | 427 | 242,488(0.18%)#80 | 14,105,933(0.00%)#2,682 |
| 81. | Ottawa Hills | 399 | 242,488(0.16%)#81 | 14,105,933(0.00%)#2,780 |
| 82. | Youngstown | 395 | 242,488(0.16%)#82 | 14,105,933(0.00%)#2,790 |
| 83. | Loveland | 390 | 242,488(0.16%)#83 | 14,105,933(0.00%)#2,810 |
| 84. | Middletown | 388 | 242,488(0.16%)#84 | 14,105,933(0.00%)#2,821 |
| 85. | Macedonia | 387 | 242,488(0.16%)#85 | 14,105,933(0.00%)#2,826 |
| 86. | Elyria | 366 | 242,488(0.15%)#86 | 14,105,933(0.00%)#2,917 |
| 87. | Lorain | 351 | 242,488(0.14%)#87 | 14,105,933(0.00%)#2,990 |
| 88. | Lyndhurst | 346 | 242,488(0.14%)#88 | 14,105,933(0.00%)#3,020 |
| 89. | Hamilton | 342 | 242,488(0.14%)#89 | 14,105,933(0.00%)#3,034 |
| 90. | Bexley | 336 | 242,488(0.14%)#90 | 14,105,933(0.00%)#3,065 |
| 91. | The Village Of Indian Hill | 335 | 242,488(0.14%)#91 | 14,105,933(0.00%)#3,074 |
| 92. | Euclid | 332 | 242,488(0.14%)#92 | 14,105,933(0.00%)#3,088 |
| 93. | Springfield | 323 | 242,488(0.13%)#93 | 14,105,933(0.00%)#3,130 |
| 94. | Ada | 323 | 242,488(0.13%)#94 | 14,105,933(0.00%)#3,135 |
| 95. | Amherst | 315 | 242,488(0.13%)#95 | 14,105,933(0.00%)#3,174 |
| 96. | Montgomery | 308 | 242,488(0.13%)#96 | 14,105,933(0.00%)#3,215 |
| 97. | Miamisburg | 306 | 242,488(0.13%)#97 | 14,105,933(0.00%)#3,224 |
| 98. | Canton | 303 | 242,488(0.12%)#98 | 14,105,933(0.00%)#3,246 |
| 99. | Ontario | 295 | 242,488(0.12%)#99 | 14,105,933(0.00%)#3,292 |
| 100. | Monfort Heights | 290 | 242,488(0.12%)#100 | 14,105,933(0.00%)#3,327 |
Common Questions
What are the Top 10 Cities with the Most Immigrants from Asia in Ohio?
Top 10 Cities with the Most Immigrants from Asia in Ohio are:
#1
43,515
#2
9,064
#3
7,316
#4
6,919
#5
6,262
#6
4,276
#7
3,696
#8
2,858
#9
2,544
#10
2,513
What city has the Most Immigrants from Asia in Ohio?
Columbus has the Most Immigrants from Asia in Ohio with 43,515.
What is the Total Immigrants from Asia in the State of Ohio?
Total Immigrants from Asia in Ohio is 242,488.
What is the Total Immigrants from Asia in the United States?
Total Immigrants from Asia in the United States is 14,105,933.