Cities with the Most Immigrants from Asia in Louisiana
RELATED REPORTS & OPTIONS
Asia
Louisiana
Compare Cities
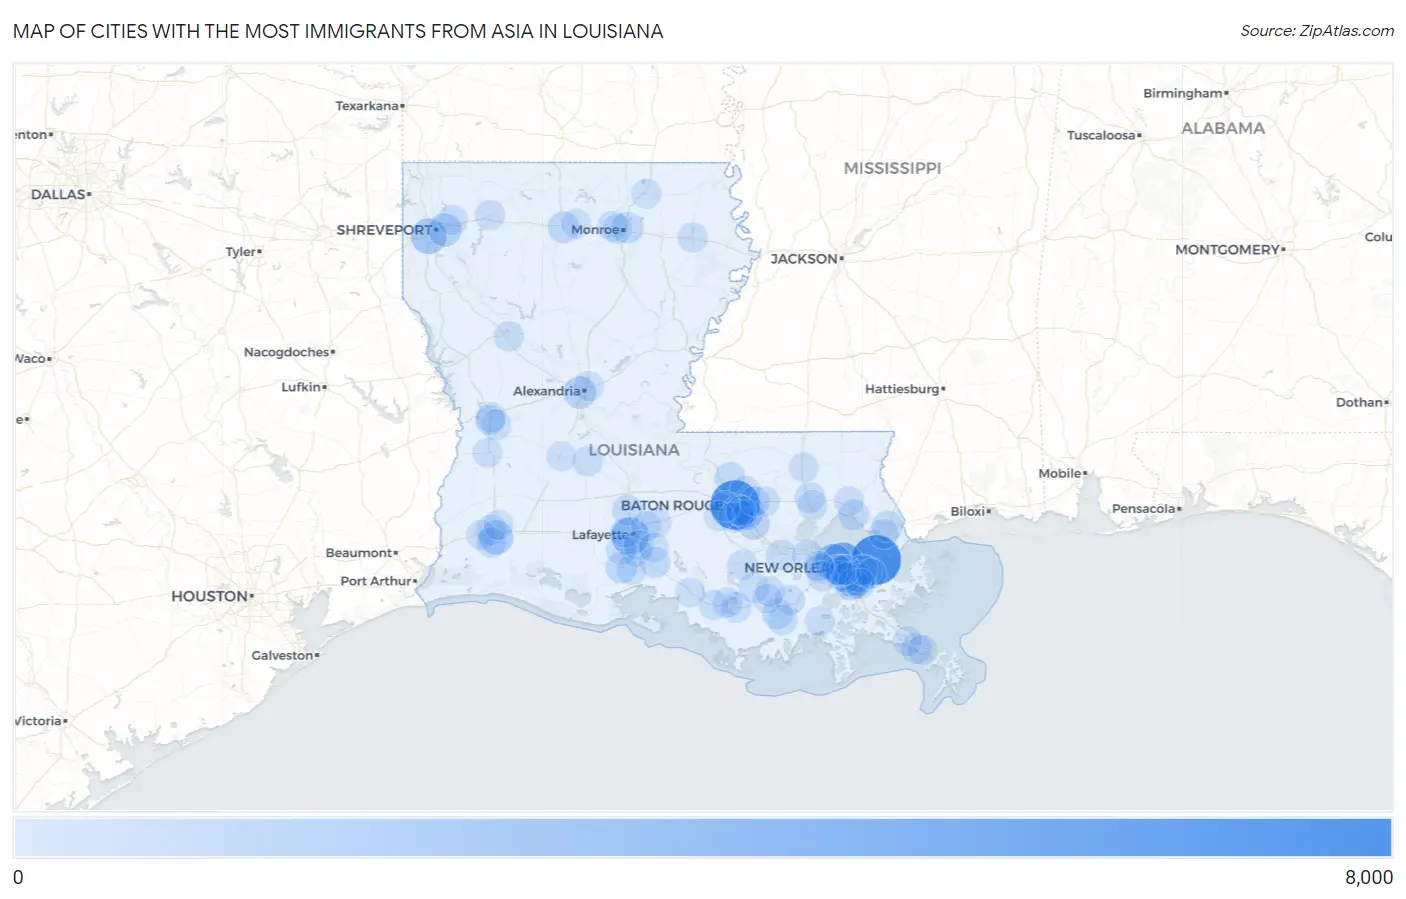
Map of Cities with the Most Immigrants from Asia in Louisiana
0
8,000
Cities with the Most Immigrants from Asia in Louisiana
| City | Asia | vs State | vs National | |
| 1. | New Orleans | 7,498 | 62,677(11.96%)#1 | 14,105,933(0.05%)#272 |
| 2. | Baton Rouge | 7,428 | 62,677(11.85%)#2 | 14,105,933(0.05%)#277 |
| 3. | Metairie | 4,760 | 62,677(7.59%)#3 | 14,105,933(0.03%)#455 |
| 4. | Lafayette | 2,893 | 62,677(4.62%)#4 | 14,105,933(0.02%)#707 |
| 5. | Kenner | 2,744 | 62,677(4.38%)#5 | 14,105,933(0.02%)#746 |
| 6. | Shreveport | 2,091 | 62,677(3.34%)#6 | 14,105,933(0.01%)#932 |
| 7. | Lake Charles | 1,503 | 62,677(2.40%)#7 | 14,105,933(0.01%)#1,217 |
| 8. | Marrero | 1,478 | 62,677(2.36%)#8 | 14,105,933(0.01%)#1,233 |
| 9. | Bossier City | 1,226 | 62,677(1.96%)#9 | 14,105,933(0.01%)#1,396 |
| 10. | Alexandria | 964 | 62,677(1.54%)#10 | 14,105,933(0.01%)#1,642 |
| 11. | Terrytown | 827 | 62,677(1.32%)#11 | 14,105,933(0.01%)#1,819 |
| 12. | Harvey | 808 | 62,677(1.29%)#12 | 14,105,933(0.01%)#1,854 |
| 13. | Prairieville | 712 | 62,677(1.14%)#13 | 14,105,933(0.01%)#1,990 |
| 14. | Ruston | 650 | 62,677(1.04%)#14 | 14,105,933(0.00%)#2,098 |
| 15. | Timberlane | 617 | 62,677(0.98%)#15 | 14,105,933(0.00%)#2,167 |
| 16. | Shenandoah | 587 | 62,677(0.94%)#16 | 14,105,933(0.00%)#2,236 |
| 17. | Monroe | 534 | 62,677(0.85%)#17 | 14,105,933(0.00%)#2,354 |
| 18. | Abbeville | 461 | 62,677(0.74%)#18 | 14,105,933(0.00%)#2,574 |
| 19. | Estelle | 458 | 62,677(0.73%)#19 | 14,105,933(0.00%)#2,584 |
| 20. | Slidell | 433 | 62,677(0.69%)#20 | 14,105,933(0.00%)#2,657 |
| 21. | Bayou Cane | 384 | 62,677(0.61%)#21 | 14,105,933(0.00%)#2,843 |
| 22. | Gretna | 363 | 62,677(0.58%)#22 | 14,105,933(0.00%)#2,929 |
| 23. | Zachary | 350 | 62,677(0.56%)#23 | 14,105,933(0.00%)#2,999 |
| 24. | Mandeville | 347 | 62,677(0.55%)#24 | 14,105,933(0.00%)#3,016 |
| 25. | Chalmette | 345 | 62,677(0.55%)#25 | 14,105,933(0.00%)#3,024 |
| 26. | New Iberia | 339 | 62,677(0.54%)#26 | 14,105,933(0.00%)#3,047 |
| 27. | Sunset | 336 | 62,677(0.54%)#27 | 14,105,933(0.00%)#3,068 |
| 28. | Central | 305 | 62,677(0.49%)#28 | 14,105,933(0.00%)#3,231 |
| 29. | Avondale | 304 | 62,677(0.49%)#29 | 14,105,933(0.00%)#3,244 |
| 30. | Buras | 303 | 62,677(0.48%)#30 | 14,105,933(0.00%)#3,251 |
| 31. | Oak Hills Place | 292 | 62,677(0.47%)#31 | 14,105,933(0.00%)#3,313 |
| 32. | Hammond | 253 | 62,677(0.40%)#32 | 14,105,933(0.00%)#3,525 |
| 33. | Claiborne | 253 | 62,677(0.40%)#33 | 14,105,933(0.00%)#3,529 |
| 34. | Woodmere | 246 | 62,677(0.39%)#34 | 14,105,933(0.00%)#3,592 |
| 35. | Elmwood | 223 | 62,677(0.36%)#35 | 14,105,933(0.00%)#3,760 |
| 36. | Westlake | 208 | 62,677(0.33%)#36 | 14,105,933(0.00%)#3,890 |
| 37. | Laplace | 205 | 62,677(0.33%)#37 | 14,105,933(0.00%)#3,911 |
| 38. | Westwego | 196 | 62,677(0.31%)#38 | 14,105,933(0.00%)#4,005 |
| 39. | Luling | 181 | 62,677(0.29%)#39 | 14,105,933(0.00%)#4,146 |
| 40. | Youngsville | 179 | 62,677(0.29%)#40 | 14,105,933(0.00%)#4,166 |
| 41. | Fort Polk South | 176 | 62,677(0.28%)#41 | 14,105,933(0.00%)#4,209 |
| 42. | Harahan | 172 | 62,677(0.27%)#42 | 14,105,933(0.00%)#4,249 |
| 43. | Village St George | 169 | 62,677(0.27%)#43 | 14,105,933(0.00%)#4,277 |
| 44. | Amelia | 167 | 62,677(0.27%)#44 | 14,105,933(0.00%)#4,305 |
| 45. | Destrehan | 163 | 62,677(0.26%)#45 | 14,105,933(0.00%)#4,341 |
| 46. | Gardere | 159 | 62,677(0.25%)#46 | 14,105,933(0.00%)#4,406 |
| 47. | Arabi | 157 | 62,677(0.25%)#47 | 14,105,933(0.00%)#4,435 |
| 48. | Labadieville | 153 | 62,677(0.24%)#48 | 14,105,933(0.00%)#4,491 |
| 49. | Old Jefferson | 143 | 62,677(0.23%)#49 | 14,105,933(0.00%)#4,623 |
| 50. | Red Chute | 142 | 62,677(0.23%)#50 | 14,105,933(0.00%)#4,633 |
| 51. | Lutcher | 136 | 62,677(0.22%)#51 | 14,105,933(0.00%)#4,725 |
| 52. | Sulphur | 124 | 62,677(0.20%)#52 | 14,105,933(0.00%)#4,914 |
| 53. | Belle Chasse | 123 | 62,677(0.20%)#53 | 14,105,933(0.00%)#4,932 |
| 54. | River Ridge | 120 | 62,677(0.19%)#54 | 14,105,933(0.00%)#4,970 |
| 55. | Morgan City | 120 | 62,677(0.19%)#55 | 14,105,933(0.00%)#4,972 |
| 56. | Prien | 120 | 62,677(0.19%)#56 | 14,105,933(0.00%)#4,973 |
| 57. | Natchitoches | 112 | 62,677(0.18%)#57 | 14,105,933(0.00%)#5,103 |
| 58. | Raceland | 111 | 62,677(0.18%)#58 | 14,105,933(0.00%)#5,124 |
| 59. | Henderson | 111 | 62,677(0.18%)#59 | 14,105,933(0.00%)#5,139 |
| 60. | Minden | 102 | 62,677(0.16%)#60 | 14,105,933(0.00%)#5,271 |
| 61. | Maurice | 102 | 62,677(0.16%)#61 | 14,105,933(0.00%)#5,282 |
| 62. | Scott | 101 | 62,677(0.16%)#62 | 14,105,933(0.00%)#5,296 |
| 63. | Westminster | 100 | 62,677(0.16%)#63 | 14,105,933(0.00%)#5,327 |
| 64. | Jefferson | 98 | 62,677(0.16%)#64 | 14,105,933(0.00%)#5,359 |
| 65. | Breaux Bridge | 98 | 62,677(0.16%)#65 | 14,105,933(0.00%)#5,364 |
| 66. | Pine Prairie | 96 | 62,677(0.15%)#66 | 14,105,933(0.00%)#5,404 |
| 67. | Walker | 94 | 62,677(0.15%)#67 | 14,105,933(0.00%)#5,442 |
| 68. | Leesville | 88 | 62,677(0.14%)#68 | 14,105,933(0.00%)#5,582 |
| 69. | Delhi | 87 | 62,677(0.14%)#69 | 14,105,933(0.00%)#5,613 |
| 70. | Thibodaux | 82 | 62,677(0.13%)#70 | 14,105,933(0.00%)#5,705 |
| 71. | Port Allen | 82 | 62,677(0.13%)#71 | 14,105,933(0.00%)#5,719 |
| 72. | Meraux | 81 | 62,677(0.13%)#72 | 14,105,933(0.00%)#5,739 |
| 73. | Paincourtville | 80 | 62,677(0.13%)#73 | 14,105,933(0.00%)#5,783 |
| 74. | New Sarpy | 79 | 62,677(0.13%)#74 | 14,105,933(0.00%)#5,814 |
| 75. | Larose | 75 | 62,677(0.12%)#75 | 14,105,933(0.00%)#5,911 |
| 76. | Eden Isle | 72 | 62,677(0.11%)#76 | 14,105,933(0.00%)#5,991 |
| 77. | Houma | 70 | 62,677(0.11%)#77 | 14,105,933(0.00%)#6,047 |
| 78. | New Llano | 68 | 62,677(0.11%)#78 | 14,105,933(0.00%)#6,133 |
| 79. | New Orleans Station | 67 | 62,677(0.11%)#79 | 14,105,933(0.00%)#6,160 |
| 80. | Deridder | 62 | 62,677(0.10%)#80 | 14,105,933(0.00%)#6,312 |
| 81. | Bastrop | 54 | 62,677(0.09%)#81 | 14,105,933(0.00%)#6,605 |
| 82. | Triumph | 54 | 62,677(0.09%)#82 | 14,105,933(0.00%)#6,635 |
| 83. | Erath | 53 | 62,677(0.08%)#83 | 14,105,933(0.00%)#6,671 |
| 84. | Broussard | 52 | 62,677(0.08%)#84 | 14,105,933(0.00%)#6,689 |
| 85. | Moss Bluff | 52 | 62,677(0.08%)#85 | 14,105,933(0.00%)#6,691 |
| 86. | Denham Springs | 52 | 62,677(0.08%)#86 | 14,105,933(0.00%)#6,696 |
| 87. | Patterson | 52 | 62,677(0.08%)#87 | 14,105,933(0.00%)#6,702 |
| 88. | Amite City | 52 | 62,677(0.08%)#88 | 14,105,933(0.00%)#6,706 |
| 89. | West Monroe | 50 | 62,677(0.08%)#89 | 14,105,933(0.00%)#6,771 |
| 90. | Pineville | 49 | 62,677(0.08%)#90 | 14,105,933(0.00%)#6,821 |
| 91. | Addis | 47 | 62,677(0.07%)#91 | 14,105,933(0.00%)#6,931 |
| 92. | Inniswold | 42 | 62,677(0.07%)#92 | 14,105,933(0.00%)#7,180 |
| 93. | Schriever | 42 | 62,677(0.07%)#93 | 14,105,933(0.00%)#7,185 |
| 94. | Ponchatoula | 41 | 62,677(0.07%)#94 | 14,105,933(0.00%)#7,227 |
| 95. | Empire | 41 | 62,677(0.07%)#95 | 14,105,933(0.00%)#7,268 |
| 96. | Oakdale | 39 | 62,677(0.06%)#96 | 14,105,933(0.00%)#7,349 |
| 97. | Choudrant | 37 | 62,677(0.06%)#97 | 14,105,933(0.00%)#7,509 |
| 98. | Covington | 36 | 62,677(0.06%)#98 | 14,105,933(0.00%)#7,525 |
| 99. | Franklin | 33 | 62,677(0.05%)#99 | 14,105,933(0.00%)#7,726 |
| 100. | St Martinville | 30 | 62,677(0.05%)#100 | 14,105,933(0.00%)#7,944 |
Common Questions
What are the Top 10 Cities with the Most Immigrants from Asia in Louisiana?
Top 10 Cities with the Most Immigrants from Asia in Louisiana are:
#1
7,498
#2
7,428
#3
4,760
#4
2,893
#5
2,744
#6
2,091
#7
1,503
#8
1,478
#9
1,226
#10
964
What city has the Most Immigrants from Asia in Louisiana?
New Orleans has the Most Immigrants from Asia in Louisiana with 7,498.
What is the Total Immigrants from Asia in the State of Louisiana?
Total Immigrants from Asia in Louisiana is 62,677.
What is the Total Immigrants from Asia in the United States?
Total Immigrants from Asia in the United States is 14,105,933.