Cities with the Most Immigrants from Asia in Oklahoma
RELATED REPORTS & OPTIONS
Asia
Oklahoma
Compare Cities
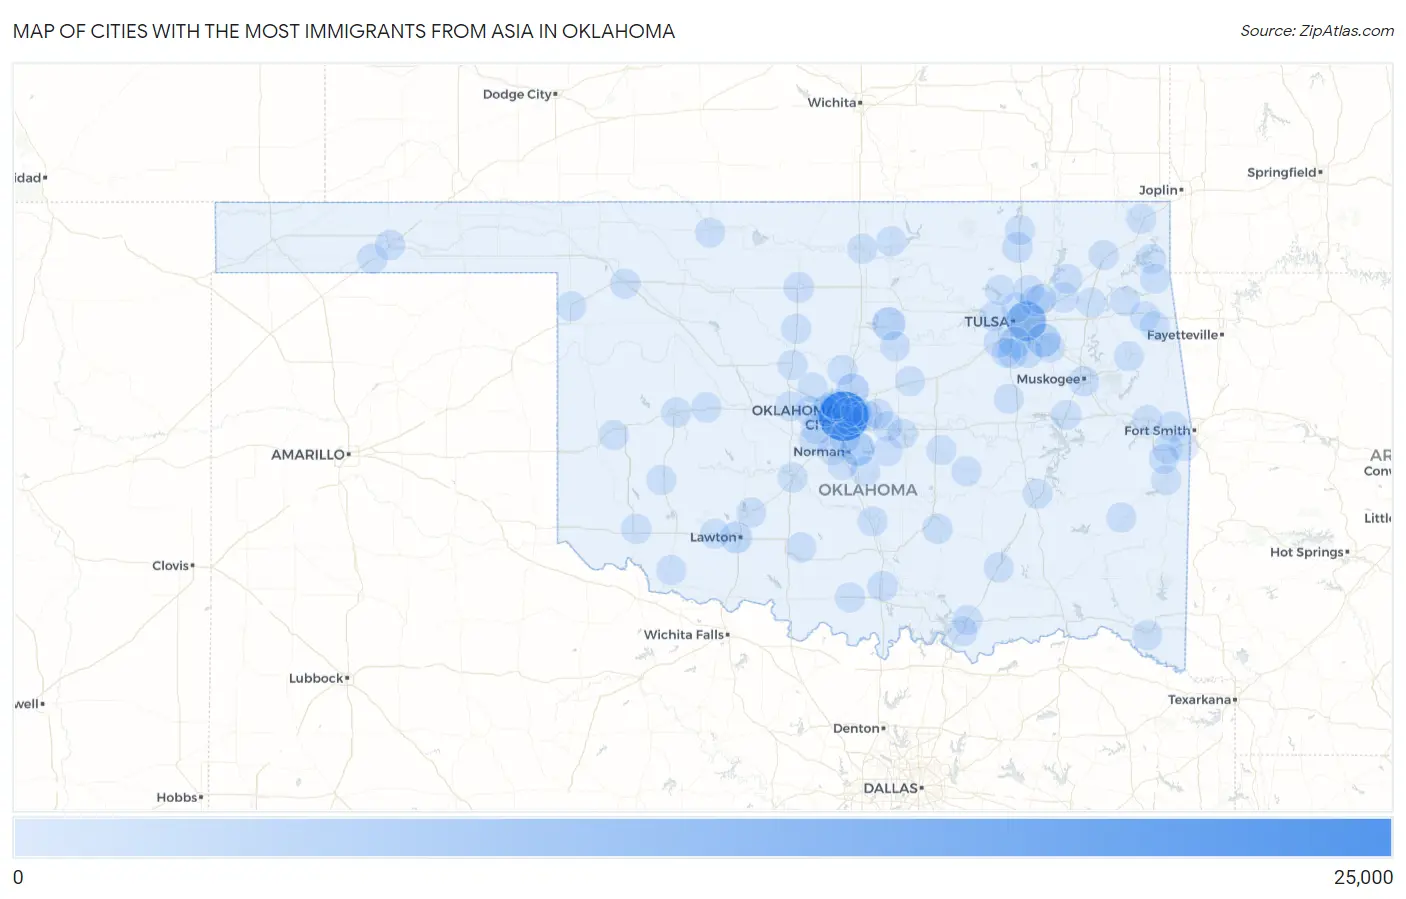
Map of Cities with the Most Immigrants from Asia in Oklahoma
0
25,000
Cities with the Most Immigrants from Asia in Oklahoma
| City | Asia | vs State | vs National | |
| 1. | Oklahoma City | 22,420 | 67,760(33.09%)#1 | 14,105,933(0.16%)#71 |
| 2. | Tulsa | 10,730 | 67,760(15.84%)#2 | 14,105,933(0.08%)#191 |
| 3. | Norman | 4,538 | 67,760(6.70%)#3 | 14,105,933(0.03%)#476 |
| 4. | Broken Arrow | 3,632 | 67,760(5.36%)#4 | 14,105,933(0.03%)#586 |
| 5. | Stillwater | 3,355 | 67,760(4.95%)#5 | 14,105,933(0.02%)#620 |
| 6. | Edmond | 2,838 | 67,760(4.19%)#6 | 14,105,933(0.02%)#719 |
| 7. | Lawton | 1,823 | 67,760(2.69%)#7 | 14,105,933(0.01%)#1,045 |
| 8. | Jenks | 1,607 | 67,760(2.37%)#8 | 14,105,933(0.01%)#1,166 |
| 9. | Moore | 1,095 | 67,760(1.62%)#9 | 14,105,933(0.01%)#1,502 |
| 10. | Midwest City | 724 | 67,760(1.07%)#10 | 14,105,933(0.01%)#1,967 |
| 11. | Bixby | 669 | 67,760(0.99%)#11 | 14,105,933(0.00%)#2,063 |
| 12. | Bartlesville | 590 | 67,760(0.87%)#12 | 14,105,933(0.00%)#2,227 |
| 13. | Owasso | 472 | 67,760(0.70%)#13 | 14,105,933(0.00%)#2,530 |
| 14. | Enid | 447 | 67,760(0.66%)#14 | 14,105,933(0.00%)#2,614 |
| 15. | Ardmore | 442 | 67,760(0.65%)#15 | 14,105,933(0.00%)#2,635 |
| 16. | Warr Acres | 426 | 67,760(0.63%)#16 | 14,105,933(0.00%)#2,687 |
| 17. | Muskogee | 347 | 67,760(0.51%)#17 | 14,105,933(0.00%)#3,014 |
| 18. | Glenpool | 320 | 67,760(0.47%)#18 | 14,105,933(0.00%)#3,146 |
| 19. | Del City | 318 | 67,760(0.47%)#19 | 14,105,933(0.00%)#3,156 |
| 20. | Mustang | 306 | 67,760(0.45%)#20 | 14,105,933(0.00%)#3,223 |
| 21. | Choctaw | 266 | 67,760(0.39%)#21 | 14,105,933(0.00%)#3,456 |
| 22. | Sapulpa | 245 | 67,760(0.36%)#22 | 14,105,933(0.00%)#3,597 |
| 23. | Ada | 214 | 67,760(0.32%)#23 | 14,105,933(0.00%)#3,840 |
| 24. | Guymon | 205 | 67,760(0.30%)#24 | 14,105,933(0.00%)#3,913 |
| 25. | Yukon | 199 | 67,760(0.29%)#25 | 14,105,933(0.00%)#3,974 |
| 26. | Claremore | 184 | 67,760(0.27%)#26 | 14,105,933(0.00%)#4,118 |
| 27. | Shawnee | 181 | 67,760(0.27%)#27 | 14,105,933(0.00%)#4,143 |
| 28. | Altus | 174 | 67,760(0.26%)#28 | 14,105,933(0.00%)#4,226 |
| 29. | Bethany | 161 | 67,760(0.24%)#29 | 14,105,933(0.00%)#4,366 |
| 30. | Muldrow | 125 | 67,760(0.18%)#30 | 14,105,933(0.00%)#4,909 |
| 31. | Nichols Hills | 121 | 67,760(0.18%)#31 | 14,105,933(0.00%)#4,962 |
| 32. | Piedmont | 119 | 67,760(0.18%)#32 | 14,105,933(0.00%)#4,983 |
| 33. | Ponca City | 117 | 67,760(0.17%)#33 | 14,105,933(0.00%)#5,019 |
| 34. | Weatherford | 117 | 67,760(0.17%)#34 | 14,105,933(0.00%)#5,023 |
| 35. | Kingfisher | 117 | 67,760(0.17%)#35 | 14,105,933(0.00%)#5,032 |
| 36. | Durant | 116 | 67,760(0.17%)#36 | 14,105,933(0.00%)#5,039 |
| 37. | Harrah | 115 | 67,760(0.17%)#37 | 14,105,933(0.00%)#5,063 |
| 38. | Okmulgee | 109 | 67,760(0.16%)#38 | 14,105,933(0.00%)#5,164 |
| 39. | Guthrie | 100 | 67,760(0.15%)#39 | 14,105,933(0.00%)#5,315 |
| 40. | Atoka | 100 | 67,760(0.15%)#40 | 14,105,933(0.00%)#5,326 |
| 41. | Duncan | 87 | 67,760(0.13%)#41 | 14,105,933(0.00%)#5,591 |
| 42. | Turley | 87 | 67,760(0.13%)#42 | 14,105,933(0.00%)#5,612 |
| 43. | Tahlequah | 83 | 67,760(0.12%)#43 | 14,105,933(0.00%)#5,676 |
| 44. | Collinsville | 83 | 67,760(0.12%)#44 | 14,105,933(0.00%)#5,684 |
| 45. | Mcloud | 82 | 67,760(0.12%)#45 | 14,105,933(0.00%)#5,720 |
| 46. | Elk City | 74 | 67,760(0.11%)#46 | 14,105,933(0.00%)#5,929 |
| 47. | Clinton | 65 | 67,760(0.10%)#47 | 14,105,933(0.00%)#6,215 |
| 48. | Vinita | 64 | 67,760(0.09%)#48 | 14,105,933(0.00%)#6,251 |
| 49. | The Village | 61 | 67,760(0.09%)#49 | 14,105,933(0.00%)#6,355 |
| 50. | Slaughterville | 58 | 67,760(0.09%)#50 | 14,105,933(0.00%)#6,471 |
| 51. | Idabel | 57 | 67,760(0.08%)#51 | 14,105,933(0.00%)#6,497 |
| 52. | Woodward | 55 | 67,760(0.08%)#52 | 14,105,933(0.00%)#6,561 |
| 53. | Grove | 55 | 67,760(0.08%)#53 | 14,105,933(0.00%)#6,567 |
| 54. | Sand Springs | 53 | 67,760(0.08%)#54 | 14,105,933(0.00%)#6,636 |
| 55. | Mcalester | 51 | 67,760(0.08%)#55 | 14,105,933(0.00%)#6,734 |
| 56. | Skiatook | 49 | 67,760(0.07%)#56 | 14,105,933(0.00%)#6,831 |
| 57. | Chickasha | 48 | 67,760(0.07%)#57 | 14,105,933(0.00%)#6,875 |
| 58. | Tuttle | 45 | 67,760(0.07%)#58 | 14,105,933(0.00%)#7,015 |
| 59. | Limestone | 45 | 67,760(0.07%)#59 | 14,105,933(0.00%)#7,049 |
| 60. | Seminole | 43 | 67,760(0.06%)#60 | 14,105,933(0.00%)#7,121 |
| 61. | Pink | 43 | 67,760(0.06%)#61 | 14,105,933(0.00%)#7,156 |
| 62. | Miami | 40 | 67,760(0.06%)#62 | 14,105,933(0.00%)#7,281 |
| 63. | Pauls Valley | 39 | 67,760(0.06%)#63 | 14,105,933(0.00%)#7,351 |
| 64. | Spencer | 39 | 67,760(0.06%)#64 | 14,105,933(0.00%)#7,363 |
| 65. | Dewey | 39 | 67,760(0.06%)#65 | 14,105,933(0.00%)#7,366 |
| 66. | El Reno | 38 | 67,760(0.06%)#66 | 14,105,933(0.00%)#7,395 |
| 67. | Chandler | 38 | 67,760(0.06%)#67 | 14,105,933(0.00%)#7,431 |
| 68. | Goodwell | 36 | 67,760(0.05%)#68 | 14,105,933(0.00%)#7,573 |
| 69. | Chewey | 36 | 67,760(0.05%)#69 | 14,105,933(0.00%)#7,576 |
| 70. | Bushyhead | 32 | 67,760(0.05%)#70 | 14,105,933(0.00%)#7,840 |
| 71. | Frederick | 31 | 67,760(0.05%)#71 | 14,105,933(0.00%)#7,889 |
| 72. | Forest Park | 31 | 67,760(0.05%)#72 | 14,105,933(0.00%)#7,923 |
| 73. | Poteau | 29 | 67,760(0.04%)#73 | 14,105,933(0.00%)#8,031 |
| 74. | Sallisaw | 29 | 67,760(0.04%)#74 | 14,105,933(0.00%)#8,032 |
| 75. | Spiro | 29 | 67,760(0.04%)#75 | 14,105,933(0.00%)#8,078 |
| 76. | Twin Oaks | 29 | 67,760(0.04%)#76 | 14,105,933(0.00%)#8,119 |
| 77. | Elgin | 26 | 67,760(0.04%)#77 | 14,105,933(0.00%)#8,308 |
| 78. | Hobart | 25 | 67,760(0.04%)#78 | 14,105,933(0.00%)#8,414 |
| 79. | Perkins | 25 | 67,760(0.04%)#79 | 14,105,933(0.00%)#8,417 |
| 80. | Pryor Creek | 23 | 67,760(0.03%)#80 | 14,105,933(0.00%)#8,598 |
| 81. | Calera | 23 | 67,760(0.03%)#81 | 14,105,933(0.00%)#8,645 |
| 82. | Pocola | 22 | 67,760(0.03%)#82 | 14,105,933(0.00%)#8,737 |
| 83. | Shattuck | 22 | 67,760(0.03%)#83 | 14,105,933(0.00%)#8,794 |
| 84. | Talihina | 22 | 67,760(0.03%)#84 | 14,105,933(0.00%)#8,805 |
| 85. | Panama | 20 | 67,760(0.03%)#85 | 14,105,933(0.00%)#9,019 |
| 86. | Cookson | 20 | 67,760(0.03%)#86 | 14,105,933(0.00%)#9,022 |
| 87. | Newcastle | 19 | 67,760(0.03%)#87 | 14,105,933(0.00%)#9,049 |
| 88. | Alva | 18 | 67,760(0.03%)#88 | 14,105,933(0.00%)#9,189 |
| 89. | Cache | 18 | 67,760(0.03%)#89 | 14,105,933(0.00%)#9,212 |
| 90. | Wilson | 17 | 67,760(0.03%)#90 | 14,105,933(0.00%)#9,402 |
| 91. | Deer Lick | 17 | 67,760(0.03%)#91 | 14,105,933(0.00%)#9,457 |
| 92. | Goldsby | 16 | 67,760(0.02%)#92 | 14,105,933(0.00%)#9,499 |
| 93. | Holdenville | 15 | 67,760(0.02%)#93 | 14,105,933(0.00%)#9,593 |
| 94. | Kiefer | 15 | 67,760(0.02%)#94 | 14,105,933(0.00%)#9,646 |
| 95. | Kenwood | 15 | 67,760(0.02%)#95 | 14,105,933(0.00%)#9,681 |
| 96. | Baron | 15 | 67,760(0.02%)#96 | 14,105,933(0.00%)#9,720 |
| 97. | Coweta | 14 | 67,760(0.02%)#97 | 14,105,933(0.00%)#9,737 |
| 98. | Checotah | 14 | 67,760(0.02%)#98 | 14,105,933(0.00%)#9,777 |
| 99. | Tonkawa | 14 | 67,760(0.02%)#99 | 14,105,933(0.00%)#9,780 |
| 100. | Hennessey | 14 | 67,760(0.02%)#100 | 14,105,933(0.00%)#9,789 |
Common Questions
What are the Top 10 Cities with the Most Immigrants from Asia in Oklahoma?
Top 10 Cities with the Most Immigrants from Asia in Oklahoma are:
#1
22,420
#2
10,730
#3
4,538
#4
3,632
#5
3,355
#6
2,838
#7
1,823
#8
1,607
#9
1,095
#10
724
What city has the Most Immigrants from Asia in Oklahoma?
Oklahoma City has the Most Immigrants from Asia in Oklahoma with 22,420.
What is the Total Immigrants from Asia in the State of Oklahoma?
Total Immigrants from Asia in Oklahoma is 67,760.
What is the Total Immigrants from Asia in the United States?
Total Immigrants from Asia in the United States is 14,105,933.