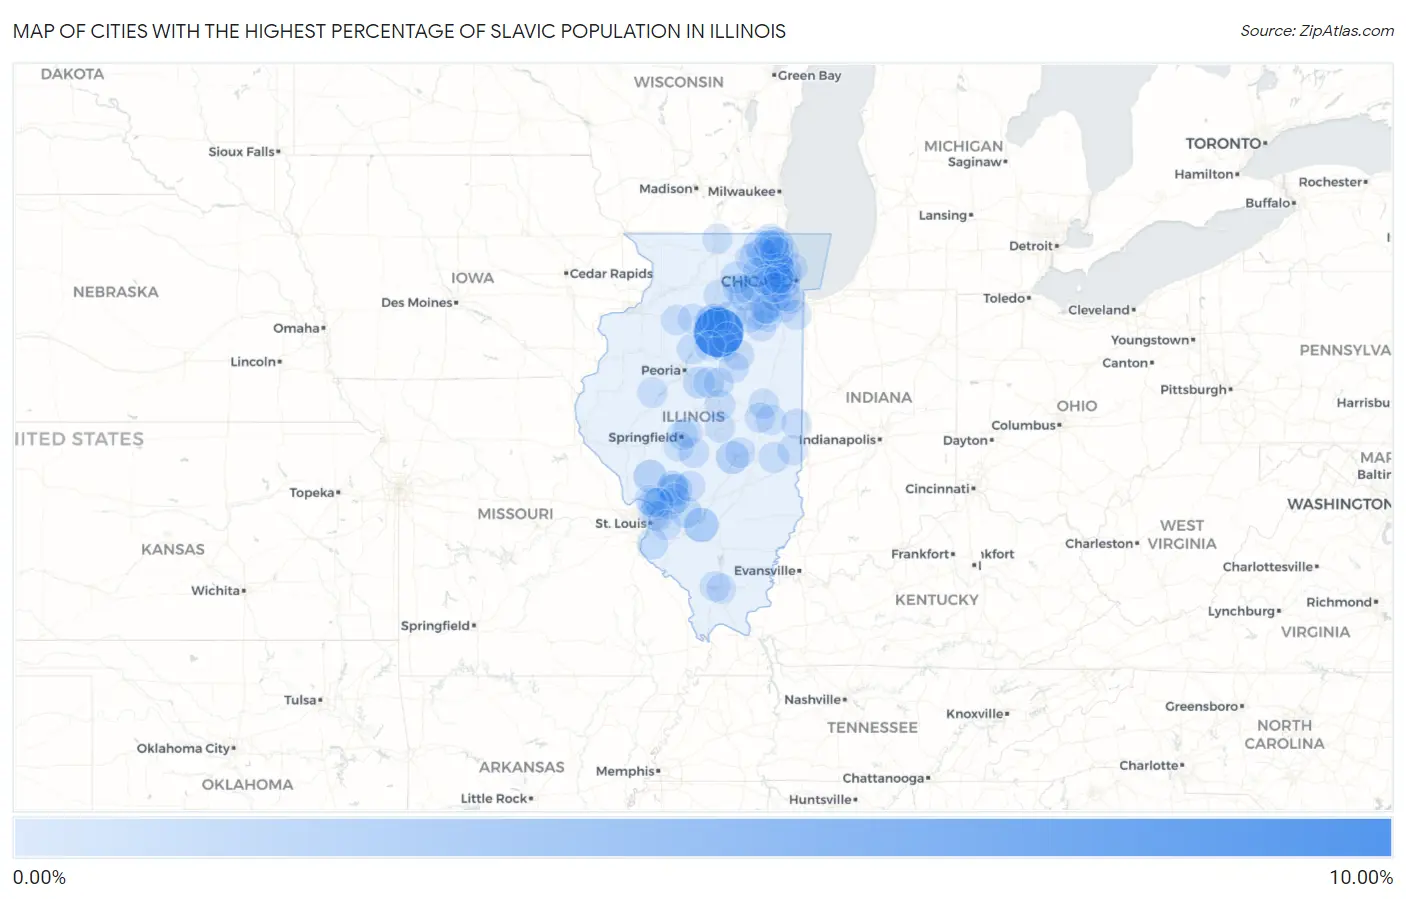
Cities with the Highest Percentage of Slavic Population in Illinois
RELATED REPORTS & OPTIONS
Slavic
Illinois
Compare Cities
Map of Cities with the Highest Percentage of Slavic Population in Illinois
0.00%
10.00%
Cities with the Highest Percentage of Slavic Population in Illinois
| City | Slavic | vs State | vs National | |
| 1. | Leonore | 9.85% | 0.041%(+9.81)#1 | 0.039%(+9.81)#7 |
| 2. | Huey | 2.26% | 0.041%(+2.21)#2 | 0.039%(+2.22)#69 |
| 3. | Rockbridge | 1.48% | 0.041%(+1.44)#3 | 0.039%(+1.44)#134 |
| 4. | Findlay | 1.43% | 0.041%(+1.39)#4 | 0.039%(+1.40)#143 |
| 5. | Lasalle | 1.25% | 0.041%(+1.21)#5 | 0.039%(+1.22)#169 |
| 6. | Vernon Hills | 1.21% | 0.041%(+1.17)#6 | 0.039%(+1.18)#178 |
| 7. | Plano | 1.08% | 0.041%(+1.04)#7 | 0.039%(+1.04)#199 |
| 8. | Mount Olive | 1.07% | 0.041%(+1.03)#8 | 0.039%(+1.03)#202 |
| 9. | Sawyerville | 1.01% | 0.041%(+0.964)#9 | 0.039%(+0.966)#221 |
| 10. | Dayton | 1.00% | 0.041%(+0.963)#10 | 0.039%(+0.965)#222 |
| 11. | Harwood Heights | 0.98% | 0.041%(+0.943)#11 | 0.039%(+0.945)#236 |
| 12. | Rosewood Heights | 0.97% | 0.041%(+0.929)#12 | 0.039%(+0.930)#242 |
| 13. | Mackinaw | 0.88% | 0.041%(+0.835)#13 | 0.039%(+0.836)#278 |
| 14. | Cortland | 0.80% | 0.041%(+0.762)#14 | 0.039%(+0.764)#305 |
| 15. | East Gillespie | 0.69% | 0.041%(+0.651)#15 | 0.039%(+0.653)#357 |
| 16. | Sugar Grove | 0.68% | 0.041%(+0.640)#16 | 0.039%(+0.642)#360 |
| 17. | Pierron | 0.65% | 0.041%(+0.607)#17 | 0.039%(+0.609)#372 |
| 18. | Hamel | 0.63% | 0.041%(+0.592)#18 | 0.039%(+0.594)#386 |
| 19. | Hopewell | 0.63% | 0.041%(+0.588)#19 | 0.039%(+0.590)#390 |
| 20. | Waterloo | 0.63% | 0.041%(+0.586)#20 | 0.039%(+0.587)#394 |
| 21. | Danvers | 0.58% | 0.041%(+0.537)#21 | 0.039%(+0.538)#438 |
| 22. | Peru | 0.56% | 0.041%(+0.519)#22 | 0.039%(+0.520)#449 |
| 23. | Elk Grove Village | 0.51% | 0.041%(+0.467)#23 | 0.039%(+0.469)#501 |
| 24. | Third Lake | 0.49% | 0.041%(+0.454)#24 | 0.039%(+0.455)#520 |
| 25. | Hinckley | 0.46% | 0.041%(+0.424)#25 | 0.039%(+0.425)#549 |
| 26. | Long Point | 0.46% | 0.041%(+0.420)#26 | 0.039%(+0.422)#553 |
| 27. | Pontiac | 0.44% | 0.041%(+0.396)#27 | 0.039%(+0.398)#588 |
| 28. | Bulpitt | 0.42% | 0.041%(+0.379)#28 | 0.039%(+0.381)#612 |
| 29. | Ashmore | 0.39% | 0.041%(+0.352)#29 | 0.039%(+0.354)#646 |
| 30. | Livingston | 0.39% | 0.041%(+0.349)#30 | 0.039%(+0.350)#651 |
| 31. | Wapella | 0.38% | 0.041%(+0.344)#31 | 0.039%(+0.345)#660 |
| 32. | Lake In The Hills | 0.36% | 0.041%(+0.318)#32 | 0.039%(+0.320)#712 |
| 33. | North Utica | 0.35% | 0.041%(+0.311)#33 | 0.039%(+0.313)#722 |
| 34. | Lockport | 0.35% | 0.041%(+0.308)#34 | 0.039%(+0.309)#731 |
| 35. | Mokena | 0.31% | 0.041%(+0.266)#35 | 0.039%(+0.268)#835 |
| 36. | Sidney | 0.31% | 0.041%(+0.265)#36 | 0.039%(+0.267)#838 |
| 37. | Elwood | 0.30% | 0.041%(+0.262)#37 | 0.039%(+0.263)#848 |
| 38. | Taylor Springs | 0.30% | 0.041%(+0.261)#38 | 0.039%(+0.263)#851 |
| 39. | Forsyth | 0.29% | 0.041%(+0.245)#39 | 0.039%(+0.246)#893 |
| 40. | Sullivan | 0.27% | 0.041%(+0.232)#40 | 0.039%(+0.233)#919 |
| 41. | Lewistown | 0.26% | 0.041%(+0.217)#41 | 0.039%(+0.219)#970 |
| 42. | Chenoa | 0.26% | 0.041%(+0.217)#42 | 0.039%(+0.219)#971 |
| 43. | Elmwood Park | 0.25% | 0.041%(+0.211)#43 | 0.039%(+0.212)#991 |
| 44. | Sheffield | 0.25% | 0.041%(+0.209)#44 | 0.039%(+0.211)#997 |
| 45. | Georgetown | 0.22% | 0.041%(+0.182)#45 | 0.039%(+0.184)#1,095 |
| 46. | Grandview | 0.22% | 0.041%(+0.175)#46 | 0.039%(+0.177)#1,126 |
| 47. | Streator | 0.21% | 0.041%(+0.171)#47 | 0.039%(+0.173)#1,140 |
| 48. | Diamond | 0.21% | 0.041%(+0.169)#48 | 0.039%(+0.171)#1,152 |
| 49. | Crainville | 0.21% | 0.041%(+0.168)#49 | 0.039%(+0.169)#1,161 |
| 50. | Spaulding | 0.21% | 0.041%(+0.167)#50 | 0.039%(+0.168)#1,169 |
| 51. | Crestwood | 0.20% | 0.041%(+0.164)#51 | 0.039%(+0.166)#1,182 |
| 52. | Paw Paw | 0.20% | 0.041%(+0.163)#52 | 0.039%(+0.165)#1,186 |
| 53. | North Aurora | 0.20% | 0.041%(+0.156)#53 | 0.039%(+0.158)#1,212 |
| 54. | Thomasboro | 0.20% | 0.041%(+0.155)#54 | 0.039%(+0.156)#1,224 |
| 55. | Paris | 0.19% | 0.041%(+0.151)#55 | 0.039%(+0.153)#1,240 |
| 56. | Channahon | 0.19% | 0.041%(+0.148)#56 | 0.039%(+0.149)#1,262 |
| 57. | Chatham | 0.19% | 0.041%(+0.146)#57 | 0.039%(+0.148)#1,272 |
| 58. | Granite City | 0.19% | 0.041%(+0.144)#58 | 0.039%(+0.146)#1,280 |
| 59. | Savoy | 0.18% | 0.041%(+0.144)#59 | 0.039%(+0.145)#1,285 |
| 60. | Godfrey | 0.18% | 0.041%(+0.139)#60 | 0.039%(+0.141)#1,301 |
| 61. | Arlington Heights | 0.18% | 0.041%(+0.138)#61 | 0.039%(+0.139)#1,309 |
| 62. | Crete | 0.18% | 0.041%(+0.137)#62 | 0.039%(+0.139)#1,311 |
| 63. | Lake Forest | 0.17% | 0.041%(+0.134)#63 | 0.039%(+0.136)#1,321 |
| 64. | Lemont | 0.17% | 0.041%(+0.130)#64 | 0.039%(+0.132)#1,339 |
| 65. | Pontoon Beach | 0.17% | 0.041%(+0.125)#65 | 0.039%(+0.126)#1,365 |
| 66. | Toluca | 0.16% | 0.041%(+0.120)#66 | 0.039%(+0.121)#1,397 |
| 67. | Mount Prospect | 0.15% | 0.041%(+0.114)#67 | 0.039%(+0.116)#1,425 |
| 68. | Morris | 0.14% | 0.041%(+0.104)#68 | 0.039%(+0.106)#1,482 |
| 69. | Bethalto | 0.14% | 0.041%(+0.099)#69 | 0.039%(+0.101)#1,513 |
| 70. | Streamwood | 0.13% | 0.041%(+0.086)#70 | 0.039%(+0.087)#1,591 |
| 71. | Rockdale | 0.12% | 0.041%(+0.082)#71 | 0.039%(+0.084)#1,612 |
| 72. | O Fallon | 0.12% | 0.041%(+0.081)#72 | 0.039%(+0.082)#1,622 |
| 73. | Riverside | 0.12% | 0.041%(+0.079)#73 | 0.039%(+0.080)#1,638 |
| 74. | Wheaton | 0.12% | 0.041%(+0.077)#74 | 0.039%(+0.078)#1,659 |
| 75. | Normal | 0.12% | 0.041%(+0.076)#75 | 0.039%(+0.078)#1,662 |
| 76. | Mchenry | 0.12% | 0.041%(+0.076)#76 | 0.039%(+0.077)#1,670 |
| 77. | Evanston | 0.11% | 0.041%(+0.073)#77 | 0.039%(+0.075)#1,687 |
| 78. | Joliet | 0.11% | 0.041%(+0.073)#78 | 0.039%(+0.075)#1,688 |
| 79. | Wheeling | 0.11% | 0.041%(+0.073)#79 | 0.039%(+0.074)#1,694 |
| 80. | Alton | 0.11% | 0.041%(+0.072)#80 | 0.039%(+0.074)#1,695 |
| 81. | Marion | 0.11% | 0.041%(+0.072)#81 | 0.039%(+0.074)#1,698 |
| 82. | Lake Barrington | 0.11% | 0.041%(+0.071)#82 | 0.039%(+0.072)#1,705 |
| 83. | Gurnee | 0.11% | 0.041%(+0.070)#83 | 0.039%(+0.072)#1,709 |
| 84. | Glen Ellyn | 0.11% | 0.041%(+0.069)#84 | 0.039%(+0.070)#1,726 |
| 85. | Palos Heights | 0.11% | 0.041%(+0.068)#85 | 0.039%(+0.070)#1,734 |
| 86. | Huntley | 0.11% | 0.041%(+0.068)#86 | 0.039%(+0.069)#1,737 |
| 87. | Des Plaines | 0.11% | 0.041%(+0.067)#87 | 0.039%(+0.069)#1,741 |
| 88. | Princeton | 0.10% | 0.041%(+0.063)#88 | 0.039%(+0.064)#1,777 |
| 89. | South Elgin | 0.092% | 0.041%(+0.052)#89 | 0.039%(+0.053)#1,861 |
| 90. | Roscoe | 0.090% | 0.041%(+0.049)#90 | 0.039%(+0.051)#1,888 |
| 91. | Downers Grove | 0.088% | 0.041%(+0.047)#91 | 0.039%(+0.049)#1,901 |
| 92. | Melrose Park | 0.083% | 0.041%(+0.043)#92 | 0.039%(+0.044)#1,955 |
| 93. | Westmont | 0.082% | 0.041%(+0.042)#93 | 0.039%(+0.043)#1,968 |
| 94. | Oakwood Hills | 0.081% | 0.041%(+0.040)#94 | 0.039%(+0.042)#1,984 |
| 95. | Lake Villa | 0.080% | 0.041%(+0.040)#95 | 0.039%(+0.041)#1,987 |
| 96. | Winfield | 0.080% | 0.041%(+0.040)#96 | 0.039%(+0.041)#1,989 |
| 97. | Grayslake | 0.077% | 0.041%(+0.036)#97 | 0.039%(+0.038)#2,020 |
| 98. | Elmhurst | 0.077% | 0.041%(+0.036)#98 | 0.039%(+0.038)#2,023 |
| 99. | Mundelein | 0.076% | 0.041%(+0.035)#99 | 0.039%(+0.037)#2,032 |
| 100. | Round Lake | 0.075% | 0.041%(+0.034)#100 | 0.039%(+0.036)#2,041 |
Common Questions
What are the Top 10 Cities with the Highest Percentage of Slavic Population in Illinois?
Top 10 Cities with the Highest Percentage of Slavic Population in Illinois are:
#1
9.85%
#2
2.26%
#3
1.48%
#4
1.43%
#5
1.25%
#6
1.21%
#7
1.08%
#8
1.07%
#9
1.01%
#10
1.00%
What city has the Highest Percentage of Slavic Population in Illinois?
Leonore has the Highest Percentage of Slavic Population in Illinois with 9.85%.
What is the Percentage of Slavic Population in the State of Illinois?
Percentage of Slavic Population in Illinois is 0.041%.
What is the Percentage of Slavic Population in the United States?
Percentage of Slavic Population in the United States is 0.039%.