Cities with the Highest Percentage of Slavic Population in New York
RELATED REPORTS & OPTIONS
Slavic
New York
Compare Cities
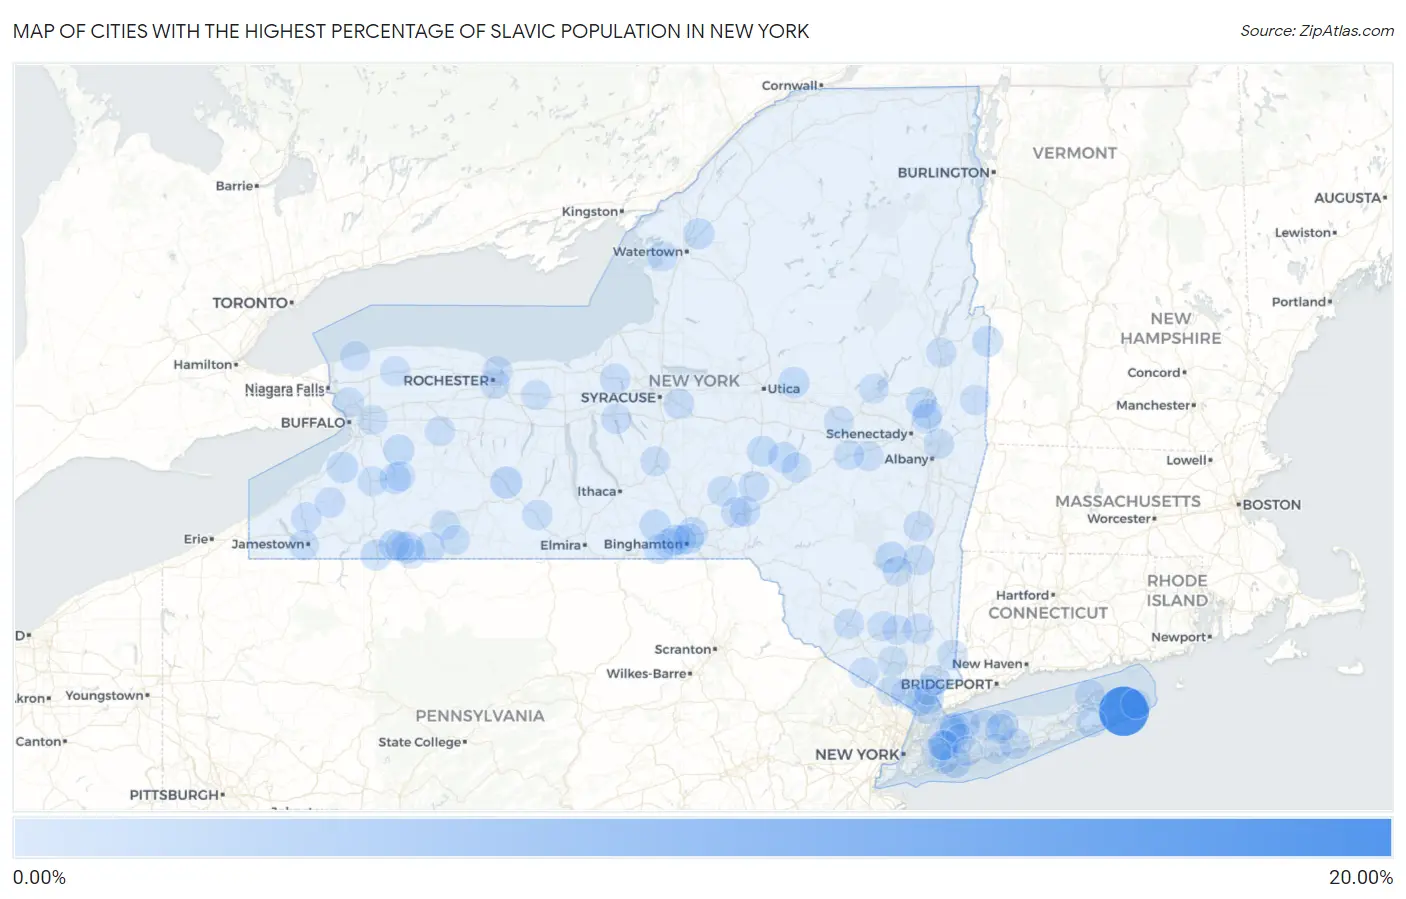
Map of Cities with the Highest Percentage of Slavic Population in New York
0.00%
20.00%
Cities with the Highest Percentage of Slavic Population in New York
| City | Slavic | vs State | vs National | |
| 1. | Napeague | 16.88% | 0.051%(+16.8)#1 | 0.039%(+16.8)#3 |
| 2. | Springfield Center | 9.33% | 0.051%(+9.28)#2 | 0.039%(+9.29)#10 |
| 3. | Varna | 2.15% | 0.051%(+2.09)#3 | 0.039%(+2.11)#72 |
| 4. | Cohocton | 1.82% | 0.051%(+1.77)#4 | 0.039%(+1.78)#99 |
| 5. | Weston Mills | 1.51% | 0.051%(+1.46)#5 | 0.039%(+1.47)#130 |
| 6. | West Hurley | 1.43% | 0.051%(+1.38)#6 | 0.039%(+1.39)#144 |
| 7. | North Collins | 1.33% | 0.051%(+1.28)#7 | 0.039%(+1.29)#158 |
| 8. | Merrick | 1.29% | 0.051%(+1.24)#8 | 0.039%(+1.26)#164 |
| 9. | Middleville | 1.13% | 0.051%(+1.07)#9 | 0.039%(+1.09)#188 |
| 10. | Yorkshire | 1.04% | 0.051%(+0.989)#10 | 0.039%(+1.00)#209 |
| 11. | Newark Valley | 1.02% | 0.051%(+0.967)#11 | 0.039%(+0.979)#217 |
| 12. | Evans Mills | 0.99% | 0.051%(+0.943)#12 | 0.039%(+0.955)#232 |
| 13. | Chenango Bridge | 0.99% | 0.051%(+0.941)#13 | 0.039%(+0.953)#233 |
| 14. | Granville | 0.97% | 0.051%(+0.919)#14 | 0.039%(+0.931)#241 |
| 15. | Strykersville | 0.96% | 0.051%(+0.905)#15 | 0.039%(+0.917)#249 |
| 16. | Hartwick | 0.94% | 0.051%(+0.890)#16 | 0.039%(+0.902)#253 |
| 17. | Limestone | 0.94% | 0.051%(+0.888)#17 | 0.039%(+0.900)#255 |
| 18. | Ballston Spa | 0.93% | 0.051%(+0.875)#18 | 0.039%(+0.888)#258 |
| 19. | Edmeston | 0.87% | 0.051%(+0.820)#19 | 0.039%(+0.832)#279 |
| 20. | Crest View Heights | 0.86% | 0.051%(+0.810)#20 | 0.039%(+0.822)#285 |
| 21. | Port Dickinson | 0.76% | 0.051%(+0.708)#21 | 0.039%(+0.720)#326 |
| 22. | North Patchogue | 0.73% | 0.051%(+0.680)#22 | 0.039%(+0.692)#338 |
| 23. | Red Hook | 0.66% | 0.051%(+0.610)#23 | 0.039%(+0.622)#368 |
| 24. | Allegany | 0.64% | 0.051%(+0.591)#24 | 0.039%(+0.604)#377 |
| 25. | Upper Brookville | 0.64% | 0.051%(+0.587)#25 | 0.039%(+0.599)#379 |
| 26. | Bainbridge | 0.62% | 0.051%(+0.571)#26 | 0.039%(+0.583)#398 |
| 27. | Endwell | 0.62% | 0.051%(+0.566)#27 | 0.039%(+0.578)#401 |
| 28. | Gilbertsville | 0.59% | 0.051%(+0.542)#28 | 0.039%(+0.554)#418 |
| 29. | Valhalla | 0.59% | 0.051%(+0.539)#29 | 0.039%(+0.551)#424 |
| 30. | Manlius | 0.58% | 0.051%(+0.526)#30 | 0.039%(+0.538)#437 |
| 31. | Lloyd Harbor | 0.56% | 0.051%(+0.509)#31 | 0.039%(+0.521)#448 |
| 32. | Sidney | 0.53% | 0.051%(+0.482)#32 | 0.039%(+0.494)#475 |
| 33. | Catskill | 0.52% | 0.051%(+0.471)#33 | 0.039%(+0.483)#485 |
| 34. | Peach Lake | 0.52% | 0.051%(+0.468)#34 | 0.039%(+0.480)#486 |
| 35. | Sinclairville | 0.50% | 0.051%(+0.453)#35 | 0.039%(+0.465)#505 |
| 36. | Melrose Park | 0.50% | 0.051%(+0.449)#36 | 0.039%(+0.462)#511 |
| 37. | South Dayton | 0.50% | 0.051%(+0.444)#37 | 0.039%(+0.456)#519 |
| 38. | Hartsdale | 0.49% | 0.051%(+0.435)#38 | 0.039%(+0.448)#527 |
| 39. | Meridian | 0.49% | 0.051%(+0.434)#39 | 0.039%(+0.446)#529 |
| 40. | Merritt Park | 0.48% | 0.051%(+0.428)#40 | 0.039%(+0.440)#534 |
| 41. | Bardonia | 0.46% | 0.051%(+0.405)#41 | 0.039%(+0.418)#557 |
| 42. | Savona | 0.45% | 0.051%(+0.395)#42 | 0.039%(+0.407)#574 |
| 43. | Endicott | 0.44% | 0.051%(+0.384)#43 | 0.039%(+0.397)#590 |
| 44. | Lakeview | 0.42% | 0.051%(+0.370)#44 | 0.039%(+0.382)#611 |
| 45. | Johnson City | 0.39% | 0.051%(+0.336)#45 | 0.039%(+0.348)#655 |
| 46. | Jamestown West | 0.39% | 0.051%(+0.335)#46 | 0.039%(+0.347)#658 |
| 47. | Apalachin | 0.38% | 0.051%(+0.331)#47 | 0.039%(+0.343)#669 |
| 48. | Bolivar | 0.38% | 0.051%(+0.330)#48 | 0.039%(+0.342)#673 |
| 49. | Green Island | 0.37% | 0.051%(+0.319)#49 | 0.039%(+0.331)#692 |
| 50. | Locust Valley | 0.36% | 0.051%(+0.309)#50 | 0.039%(+0.321)#708 |
| 51. | Stony Brook | 0.35% | 0.051%(+0.301)#51 | 0.039%(+0.313)#723 |
| 52. | Greenport | 0.35% | 0.051%(+0.299)#52 | 0.039%(+0.311)#727 |
| 53. | Brighton | 0.34% | 0.051%(+0.294)#53 | 0.039%(+0.306)#742 |
| 54. | Oxford | 0.34% | 0.051%(+0.286)#54 | 0.039%(+0.298)#756 |
| 55. | Wurtsboro | 0.33% | 0.051%(+0.277)#55 | 0.039%(+0.289)#780 |
| 56. | Sackets Harbor | 0.33% | 0.051%(+0.275)#56 | 0.039%(+0.287)#786 |
| 57. | Cobleskill | 0.31% | 0.051%(+0.262)#57 | 0.039%(+0.274)#816 |
| 58. | East Williston | 0.30% | 0.051%(+0.253)#58 | 0.039%(+0.265)#843 |
| 59. | Warwick | 0.30% | 0.051%(+0.249)#59 | 0.039%(+0.261)#856 |
| 60. | Searingtown | 0.30% | 0.051%(+0.247)#60 | 0.039%(+0.259)#865 |
| 61. | Cambridge | 0.29% | 0.051%(+0.242)#61 | 0.039%(+0.254)#879 |
| 62. | Albertson | 0.27% | 0.051%(+0.224)#62 | 0.039%(+0.236)#914 |
| 63. | Wyoming | 0.27% | 0.051%(+0.222)#63 | 0.039%(+0.234)#918 |
| 64. | Tarrytown | 0.27% | 0.051%(+0.220)#64 | 0.039%(+0.233)#922 |
| 65. | Mill Neck | 0.27% | 0.051%(+0.219)#65 | 0.039%(+0.232)#926 |
| 66. | Glens Falls North | 0.27% | 0.051%(+0.216)#66 | 0.039%(+0.228)#937 |
| 67. | Country Knolls | 0.26% | 0.051%(+0.207)#67 | 0.039%(+0.219)#969 |
| 68. | Pleasantville | 0.26% | 0.051%(+0.204)#68 | 0.039%(+0.217)#978 |
| 69. | Tonawanda | 0.26% | 0.051%(+0.204)#69 | 0.039%(+0.216)#982 |
| 70. | Walden | 0.25% | 0.051%(+0.197)#70 | 0.039%(+0.209)#1,004 |
| 71. | Irondequoit | 0.24% | 0.051%(+0.193)#71 | 0.039%(+0.205)#1,012 |
| 72. | Fort Salonga | 0.24% | 0.051%(+0.193)#72 | 0.039%(+0.205)#1,013 |
| 73. | Round Lake | 0.24% | 0.051%(+0.192)#73 | 0.039%(+0.204)#1,016 |
| 74. | Palmyra | 0.24% | 0.051%(+0.189)#74 | 0.039%(+0.201)#1,026 |
| 75. | Mount Kisco | 0.24% | 0.051%(+0.189)#75 | 0.039%(+0.201)#1,027 |
| 76. | Syosset | 0.24% | 0.051%(+0.188)#76 | 0.039%(+0.200)#1,029 |
| 77. | Belmont | 0.23% | 0.051%(+0.180)#77 | 0.039%(+0.192)#1,059 |
| 78. | Portville | 0.23% | 0.051%(+0.175)#78 | 0.039%(+0.187)#1,076 |
| 79. | Islip Terrace | 0.23% | 0.051%(+0.174)#79 | 0.039%(+0.187)#1,079 |
| 80. | Farmingdale | 0.23% | 0.051%(+0.174)#80 | 0.039%(+0.186)#1,083 |
| 81. | Olean | 0.22% | 0.051%(+0.172)#81 | 0.039%(+0.184)#1,094 |
| 82. | Homer | 0.22% | 0.051%(+0.170)#82 | 0.039%(+0.182)#1,103 |
| 83. | Wilson | 0.22% | 0.051%(+0.168)#83 | 0.039%(+0.180)#1,112 |
| 84. | Water Mill | 0.22% | 0.051%(+0.165)#84 | 0.039%(+0.178)#1,121 |
| 85. | Lancaster | 0.22% | 0.051%(+0.165)#85 | 0.039%(+0.177)#1,122 |
| 86. | Milford | 0.22% | 0.051%(+0.165)#86 | 0.039%(+0.177)#1,123 |
| 87. | Mayfield | 0.21% | 0.051%(+0.162)#87 | 0.039%(+0.174)#1,136 |
| 88. | St James | 0.21% | 0.051%(+0.160)#88 | 0.039%(+0.172)#1,143 |
| 89. | Schoharie | 0.21% | 0.051%(+0.158)#89 | 0.039%(+0.170)#1,157 |
| 90. | Canajoharie | 0.21% | 0.051%(+0.158)#90 | 0.039%(+0.170)#1,160 |
| 91. | Montauk | 0.21% | 0.051%(+0.157)#91 | 0.039%(+0.169)#1,163 |
| 92. | Hurley | 0.21% | 0.051%(+0.156)#92 | 0.039%(+0.169)#1,166 |
| 93. | Gardnertown | 0.20% | 0.051%(+0.152)#93 | 0.039%(+0.164)#1,191 |
| 94. | Middleport | 0.20% | 0.051%(+0.152)#94 | 0.039%(+0.164)#1,192 |
| 95. | Bellerose | 0.20% | 0.051%(+0.149)#95 | 0.039%(+0.161)#1,202 |
| 96. | Arcade | 0.19% | 0.051%(+0.140)#96 | 0.039%(+0.152)#1,248 |
| 97. | Springville | 0.19% | 0.051%(+0.138)#97 | 0.039%(+0.150)#1,255 |
| 98. | Wellsville | 0.18% | 0.051%(+0.134)#98 | 0.039%(+0.146)#1,281 |
| 99. | Woodbury | 0.18% | 0.051%(+0.133)#99 | 0.039%(+0.146)#1,282 |
| 100. | Montebello | 0.17% | 0.051%(+0.121)#100 | 0.039%(+0.133)#1,332 |
Common Questions
What are the Top 10 Cities with the Highest Percentage of Slavic Population in New York?
Top 10 Cities with the Highest Percentage of Slavic Population in New York are:
#1
16.88%
#2
1.82%
#3
1.51%
#4
1.43%
#5
1.33%
#6
1.29%
#7
1.13%
#8
1.04%
#9
1.02%
#10
0.99%
What city has the Highest Percentage of Slavic Population in New York?
Napeague has the Highest Percentage of Slavic Population in New York with 16.88%.
What is the Percentage of Slavic Population in the State of New York?
Percentage of Slavic Population in New York is 0.051%.
What is the Percentage of Slavic Population in the United States?
Percentage of Slavic Population in the United States is 0.039%.