Cities with the Highest Percentage of Self-Employed / Not Incorporated in North Dakota
RELATED REPORTS & OPTIONS
Self-Employed / Not Incorporated
North Dakota
Compare Cities
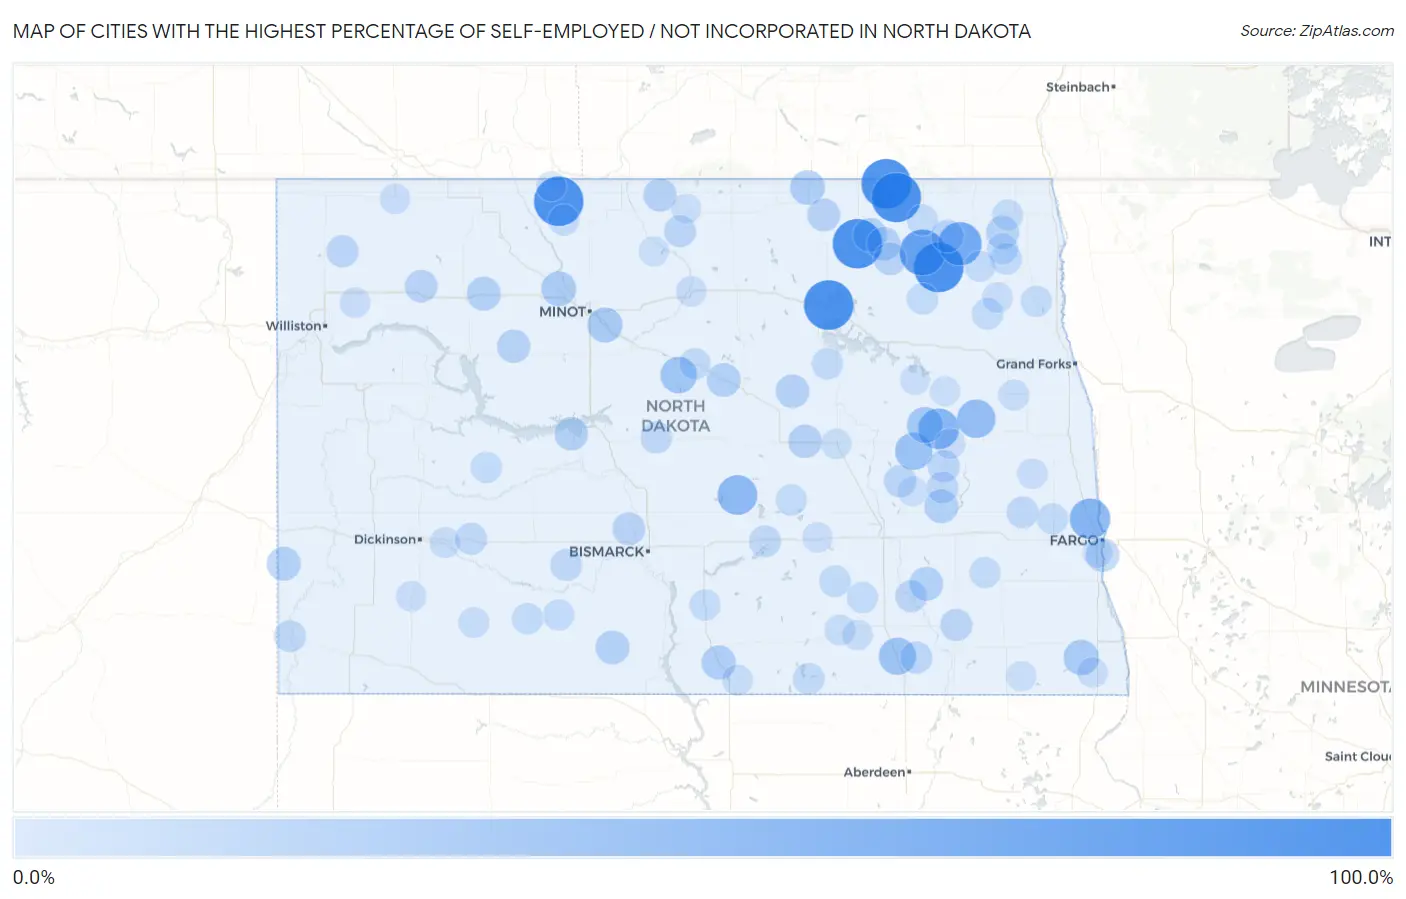
Map of Cities with the Highest Percentage of Self-Employed / Not Incorporated in North Dakota
0.0%
100.0%
Cities with the Highest Percentage of Self-Employed / Not Incorporated in North Dakota
| City | % Self-Employed / Not Incorporated | vs State | vs National | |
| 1. | Fairdale | 100.0% | 7.2%(+92.8)#1 | 5.8%(+94.2)#50 |
| 2. | Hannah | 100.0% | 7.2%(+92.8)#2 | 5.8%(+94.2)#59 |
| 3. | Loraine | 100.0% | 7.2%(+92.8)#3 | 5.8%(+94.2)#68 |
| 4. | Wales | 100.0% | 7.2%(+92.8)#4 | 5.8%(+94.2)#69 |
| 5. | Calio | 100.0% | 7.2%(+92.8)#5 | 5.8%(+94.2)#72 |
| 6. | Churchs Ferry | 100.0% | 7.2%(+92.8)#6 | 5.8%(+94.2)#76 |
| 7. | Nekoma | 83.3% | 7.2%(+76.1)#7 | 5.8%(+77.5)#82 |
| 8. | Milton | 72.2% | 7.2%(+65.0)#8 | 5.8%(+66.4)#104 |
| 9. | Jessie | 60.0% | 7.2%(+52.8)#9 | 5.8%(+54.2)#150 |
| 10. | Brooktree Park | 59.4% | 7.2%(+52.2)#10 | 5.8%(+53.6)#155 |
| 11. | Tuttle | 55.6% | 7.2%(+48.3)#11 | 5.8%(+49.7)#182 |
| 12. | Sharon | 50.0% | 7.2%(+42.8)#12 | 5.8%(+44.2)#231 |
| 13. | Sutton | 45.5% | 7.2%(+38.2)#13 | 5.8%(+39.6)#294 |
| 14. | Monango | 44.4% | 7.2%(+37.2)#14 | 5.8%(+38.6)#311 |
| 15. | Kief | 41.7% | 7.2%(+34.5)#15 | 5.8%(+35.9)#355 |
| 16. | Binford | 40.0% | 7.2%(+32.8)#16 | 5.8%(+34.2)#379 |
| 17. | Mantador | 36.4% | 7.2%(+29.2)#17 | 5.8%(+30.5)#456 |
| 18. | Logan | 35.1% | 7.2%(+27.9)#18 | 5.8%(+29.3)#485 |
| 19. | Foxholm | 34.5% | 7.2%(+27.3)#19 | 5.8%(+28.7)#502 |
| 20. | Hansboro | 33.3% | 7.2%(+26.1)#20 | 5.8%(+27.5)#537 |
| 21. | Strasburg | 31.4% | 7.2%(+24.2)#21 | 5.8%(+25.6)#592 |
| 22. | Palermo | 30.6% | 7.2%(+23.4)#22 | 5.8%(+24.8)#616 |
| 23. | Munich | 30.6% | 7.2%(+23.4)#23 | 5.8%(+24.8)#618 |
| 24. | Rogers | 30.3% | 7.2%(+23.1)#24 | 5.8%(+24.5)#635 |
| 25. | Golva | 30.2% | 7.2%(+23.0)#25 | 5.8%(+24.4)#642 |
| 26. | Martin | 30.0% | 7.2%(+22.8)#26 | 5.8%(+24.2)#652 |
| 27. | Marion | 29.8% | 7.2%(+22.6)#27 | 5.8%(+24.0)#660 |
| 28. | Porcupine | 29.6% | 7.2%(+22.4)#28 | 5.8%(+23.8)#666 |
| 29. | Briarwood | 29.0% | 7.2%(+21.8)#29 | 5.8%(+23.2)#694 |
| 30. | Alsen | 28.6% | 7.2%(+21.4)#30 | 5.8%(+22.8)#721 |
| 31. | Hamberg | 28.6% | 7.2%(+21.4)#31 | 5.8%(+22.8)#725 |
| 32. | Sykeston | 28.0% | 7.2%(+20.8)#32 | 5.8%(+22.2)#747 |
| 33. | Pick City | 27.9% | 7.2%(+20.7)#33 | 5.8%(+22.1)#757 |
| 34. | Souris | 27.6% | 7.2%(+20.4)#34 | 5.8%(+21.8)#774 |
| 35. | Plaza | 27.5% | 7.2%(+20.3)#35 | 5.8%(+21.7)#785 |
| 36. | Canton City Hensel | 27.3% | 7.2%(+20.1)#36 | 5.8%(+21.5)#797 |
| 37. | Rocklake | 26.1% | 7.2%(+18.9)#37 | 5.8%(+20.3)#865 |
| 38. | Harmon | 25.2% | 7.2%(+18.0)#38 | 5.8%(+19.4)#929 |
| 39. | Osnabrock | 25.0% | 7.2%(+17.8)#39 | 5.8%(+19.2)#945 |
| 40. | White Earth | 25.0% | 7.2%(+17.8)#40 | 5.8%(+19.2)#950 |
| 41. | Hampden | 25.0% | 7.2%(+17.8)#41 | 5.8%(+19.2)#958 |
| 42. | Verona | 23.5% | 7.2%(+16.3)#42 | 5.8%(+17.7)#1,072 |
| 43. | Alamo | 23.5% | 7.2%(+16.3)#43 | 5.8%(+17.7)#1,075 |
| 44. | Courtenay | 23.5% | 7.2%(+16.3)#44 | 5.8%(+17.7)#1,078 |
| 45. | Fullerton | 22.9% | 7.2%(+15.6)#45 | 5.8%(+17.0)#1,145 |
| 46. | Hannaford | 22.4% | 7.2%(+15.2)#46 | 5.8%(+16.6)#1,189 |
| 47. | Dickey | 22.2% | 7.2%(+15.0)#47 | 5.8%(+16.4)#1,219 |
| 48. | Gardena | 22.2% | 7.2%(+15.0)#48 | 5.8%(+16.4)#1,230 |
| 49. | Richardton | 22.1% | 7.2%(+14.9)#49 | 5.8%(+16.3)#1,233 |
| 50. | Mercer | 21.9% | 7.2%(+14.7)#50 | 5.8%(+16.1)#1,253 |
| 51. | Almont | 21.7% | 7.2%(+14.5)#51 | 5.8%(+15.9)#1,266 |
| 52. | Dazey | 21.7% | 7.2%(+14.5)#52 | 5.8%(+15.9)#1,270 |
| 53. | Dawson | 21.7% | 7.2%(+14.5)#53 | 5.8%(+15.9)#1,271 |
| 54. | Marmarth | 21.6% | 7.2%(+14.4)#54 | 5.8%(+15.8)#1,285 |
| 55. | Ayr | 21.4% | 7.2%(+14.2)#55 | 5.8%(+15.6)#1,318 |
| 56. | Ashley | 20.7% | 7.2%(+13.5)#56 | 5.8%(+14.9)#1,410 |
| 57. | Drake | 20.4% | 7.2%(+13.2)#57 | 5.8%(+14.6)#1,453 |
| 58. | Hoople | 20.0% | 7.2%(+12.8)#58 | 5.8%(+14.2)#1,500 |
| 59. | Fordville | 20.0% | 7.2%(+12.8)#59 | 5.8%(+14.2)#1,502 |
| 60. | Oberon | 20.0% | 7.2%(+12.8)#60 | 5.8%(+14.2)#1,524 |
| 61. | Lawton | 20.0% | 7.2%(+12.8)#61 | 5.8%(+14.2)#1,530 |
| 62. | Gackle | 19.8% | 7.2%(+12.6)#62 | 5.8%(+14.0)#1,551 |
| 63. | Elgin | 19.3% | 7.2%(+12.1)#63 | 5.8%(+13.5)#1,618 |
| 64. | Crystal | 19.0% | 7.2%(+11.8)#64 | 5.8%(+13.2)#1,666 |
| 65. | Pettibone | 19.0% | 7.2%(+11.8)#65 | 5.8%(+13.2)#1,668 |
| 66. | Jud | 19.0% | 7.2%(+11.8)#66 | 5.8%(+13.2)#1,669 |
| 67. | Amenia | 19.0% | 7.2%(+11.8)#67 | 5.8%(+13.2)#1,675 |
| 68. | Minto | 18.8% | 7.2%(+11.6)#68 | 5.8%(+13.0)#1,708 |
| 69. | Dodge | 18.8% | 7.2%(+11.5)#69 | 5.8%(+12.9)#1,720 |
| 70. | Langdon | 18.7% | 7.2%(+11.5)#70 | 5.8%(+12.9)#1,725 |
| 71. | Mohall | 18.7% | 7.2%(+11.5)#71 | 5.8%(+12.9)#1,726 |
| 72. | Nome | 18.5% | 7.2%(+11.3)#72 | 5.8%(+12.7)#1,760 |
| 73. | Hazelton | 18.5% | 7.2%(+11.3)#73 | 5.8%(+12.7)#1,765 |
| 74. | Carson | 18.2% | 7.2%(+11.0)#74 | 5.8%(+12.4)#1,817 |
| 75. | Cavalier | 18.0% | 7.2%(+10.7)#75 | 5.8%(+12.1)#1,863 |
| 76. | Edinburg | 17.9% | 7.2%(+10.6)#76 | 5.8%(+12.0)#1,881 |
| 77. | Northwood | 17.3% | 7.2%(+10.1)#77 | 5.8%(+11.5)#2,017 |
| 78. | Mott | 17.3% | 7.2%(+10.1)#78 | 5.8%(+11.5)#2,019 |
| 79. | Hague | 17.2% | 7.2%(+10.0)#79 | 5.8%(+11.4)#2,024 |
| 80. | Gladstone | 17.1% | 7.2%(+9.91)#80 | 5.8%(+11.3)#2,062 |
| 81. | Fredonia | 16.7% | 7.2%(+9.46)#81 | 5.8%(+10.9)#2,170 |
| 82. | New England | 16.4% | 7.2%(+9.18)#82 | 5.8%(+10.6)#2,237 |
| 83. | Towner | 16.3% | 7.2%(+9.12)#83 | 5.8%(+10.5)#2,252 |
| 84. | Pisek | 16.3% | 7.2%(+9.07)#84 | 5.8%(+10.5)#2,264 |
| 85. | Galesburg | 16.3% | 7.2%(+9.07)#85 | 5.8%(+10.5)#2,266 |
| 86. | Epping | 16.1% | 7.2%(+8.86)#86 | 5.8%(+10.3)#2,314 |
| 87. | Cooperstown | 16.0% | 7.2%(+8.84)#87 | 5.8%(+10.2)#2,320 |
| 88. | Kulm | 15.9% | 7.2%(+8.69)#88 | 5.8%(+10.1)#2,366 |
| 89. | Noonan | 15.8% | 7.2%(+8.58)#89 | 5.8%(+9.97)#2,406 |
| 90. | Hankinson | 15.5% | 7.2%(+8.34)#90 | 5.8%(+9.73)#2,465 |
| 91. | Carrington | 15.4% | 7.2%(+8.20)#91 | 5.8%(+9.59)#2,503 |
| 92. | Medina | 15.3% | 7.2%(+8.11)#92 | 5.8%(+9.51)#2,539 |
| 93. | Upham | 14.8% | 7.2%(+7.55)#93 | 5.8%(+8.94)#2,726 |
| 94. | Frontier | 14.7% | 7.2%(+7.50)#94 | 5.8%(+8.89)#2,742 |
| 95. | Rutland | 14.6% | 7.2%(+7.43)#95 | 5.8%(+8.82)#2,763 |
| 96. | Mcville | 14.6% | 7.2%(+7.41)#96 | 5.8%(+8.80)#2,768 |
| 97. | Sherwood | 14.6% | 7.2%(+7.37)#97 | 5.8%(+8.77)#2,779 |
| 98. | Wimbledon | 14.4% | 7.2%(+7.24)#98 | 5.8%(+8.63)#2,819 |
| 99. | Bottineau | 14.4% | 7.2%(+7.22)#99 | 5.8%(+8.62)#2,821 |
| 100. | Tolna | 14.3% | 7.2%(+7.08)#100 | 5.8%(+8.47)#2,877 |
Common Questions
What are the Top 10 Cities with the Highest Percentage of Self-Employed / Not Incorporated in North Dakota?
Top 10 Cities with the Highest Percentage of Self-Employed / Not Incorporated in North Dakota are:
#1
100.0%
#2
100.0%
#3
100.0%
#4
100.0%
#5
100.0%
#6
100.0%
#7
83.3%
#8
72.2%
#9
60.0%
#10
59.4%
What city has the Highest Percentage of Self-Employed / Not Incorporated in North Dakota?
Fairdale has the Highest Percentage of Self-Employed / Not Incorporated in North Dakota with 100.0%.
What is the Percentage of Self-Employed / Not Incorporated in the State of North Dakota?
Percentage of Self-Employed / Not Incorporated in North Dakota is 7.2%.
What is the Percentage of Self-Employed / Not Incorporated in the United States?
Percentage of Self-Employed / Not Incorporated in the United States is 5.8%.