Cities with the Highest Percentage of Self-Employed / Not Incorporated in Rhode Island
RELATED REPORTS & OPTIONS
Self-Employed / Not Incorporated
Rhode Island
Compare Cities
Map of Cities with the Highest Percentage of Self-Employed / Not Incorporated in Rhode Island
0.0%
25.0%
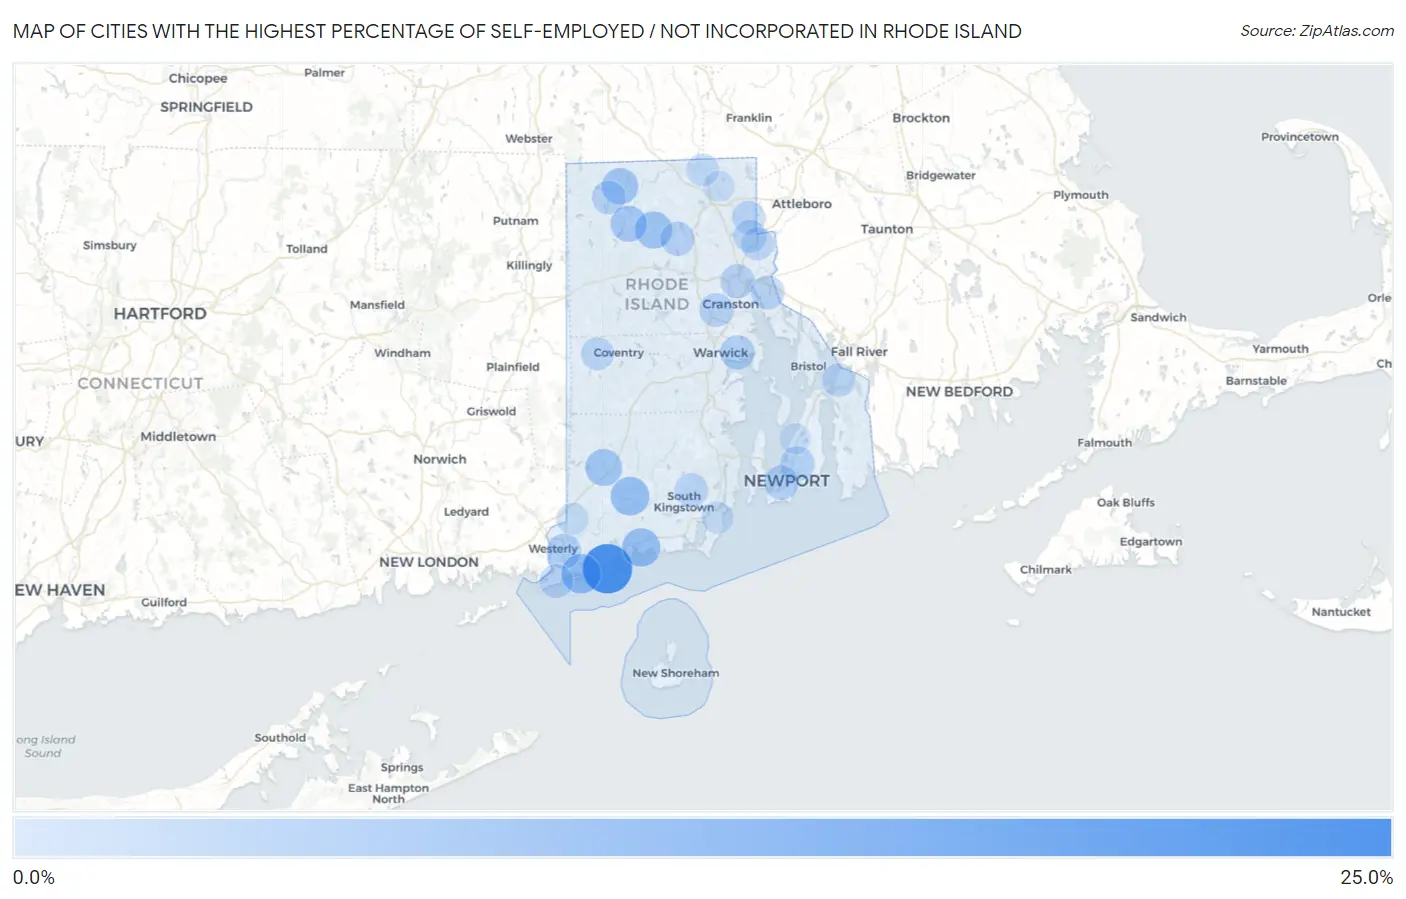
Cities with the Highest Percentage of Self-Employed / Not Incorporated in Rhode Island
| City | % Self-Employed / Not Incorporated | vs State | vs National | |
| 1. | Quonochontaug | 23.4% | 4.7%(+18.7)#1 | 5.8%(+17.6)#1,085 |
| 2. | Weekapaug | 11.0% | 4.7%(+6.30)#2 | 5.8%(+5.21)#4,679 |
| 3. | Carolina | 10.0% | 4.7%(+5.27)#3 | 5.8%(+4.18)#5,508 |
| 4. | Charlestown | 9.7% | 4.7%(+5.00)#4 | 5.8%(+3.91)#5,844 |
| 5. | Harmony | 8.3% | 4.7%(+3.55)#5 | 5.8%(+2.47)#7,582 |
| 6. | Hope Valley | 8.1% | 4.7%(+3.36)#6 | 5.8%(+2.28)#7,848 |
| 7. | Harrisville | 7.5% | 4.7%(+2.78)#7 | 5.8%(+1.69)#8,802 |
| 8. | Chepachet | 7.2% | 4.7%(+2.51)#8 | 5.8%(+1.43)#9,276 |
| 9. | Westerly | 5.6% | 4.7%(+0.896)#9 | 5.8%(-0.190)#12,997 |
| 10. | Wakefield-Peace Dale | 5.6% | 4.7%(+0.867)#10 | 5.8%(-0.219)#13,079 |
| 11. | Newport East | 5.1% | 4.7%(+0.371)#11 | 5.8%(-0.715)#14,528 |
| 12. | Warwick | 5.0% | 4.7%(+0.300)#12 | 5.8%(-0.786)#14,740 |
| 13. | Newport | 5.0% | 4.7%(+0.281)#13 | 5.8%(-0.805)#14,799 |
| 14. | Providence | 4.9% | 4.7%(+0.150)#14 | 5.8%(-0.936)#15,205 |
| 15. | Greenville | 4.8% | 4.7%(+0.066)#15 | 5.8%(-1.02)#15,467 |
| 16. | Cranston | 4.6% | 4.7%(-0.131)#16 | 5.8%(-1.22)#16,085 |
| 17. | Pascoag | 4.4% | 4.7%(-0.338)#17 | 5.8%(-1.42)#16,791 |
| 18. | East Providence | 4.4% | 4.7%(-0.362)#18 | 5.8%(-1.45)#16,854 |
| 19. | Misquamicut | 4.3% | 4.7%(-0.444)#19 | 5.8%(-1.53)#17,129 |
| 20. | Kingston | 4.2% | 4.7%(-0.572)#20 | 5.8%(-1.66)#17,509 |
| 21. | Valley Falls | 3.9% | 4.7%(-0.813)#21 | 5.8%(-1.90)#18,324 |
| 22. | Tiverton | 3.9% | 4.7%(-0.846)#22 | 5.8%(-1.93)#18,410 |
| 23. | Greene | 3.5% | 4.7%(-1.19)#23 | 5.8%(-2.28)#19,517 |
| 24. | Central Falls | 3.5% | 4.7%(-1.24)#24 | 5.8%(-2.33)#19,674 |
| 25. | Pawtucket | 3.4% | 4.7%(-1.34)#25 | 5.8%(-2.42)#20,005 |
| 26. | Woonsocket | 3.1% | 4.7%(-1.67)#26 | 5.8%(-2.75)#20,981 |
| 27. | Ashaway | 2.4% | 4.7%(-2.38)#27 | 5.8%(-3.46)#22,874 |
| 28. | Narragansett Pier | 2.3% | 4.7%(-2.39)#28 | 5.8%(-3.48)#22,899 |
| 29. | Cumberland Hill | 1.5% | 4.7%(-3.23)#29 | 5.8%(-4.31)#24,637 |
| 30. | Melville | 1.4% | 4.7%(-3.30)#30 | 5.8%(-4.39)#24,761 |
1
Common Questions
What are the Top 10 Cities with the Highest Percentage of Self-Employed / Not Incorporated in Rhode Island?
Top 10 Cities with the Highest Percentage of Self-Employed / Not Incorporated in Rhode Island are:
#1
23.4%
#2
11.0%
#3
10.0%
#4
9.7%
#5
8.3%
#6
8.1%
#7
7.5%
#8
7.2%
#9
5.6%
#10
5.1%
What city has the Highest Percentage of Self-Employed / Not Incorporated in Rhode Island?
Quonochontaug has the Highest Percentage of Self-Employed / Not Incorporated in Rhode Island with 23.4%.
What is the Percentage of Self-Employed / Not Incorporated in the State of Rhode Island?
Percentage of Self-Employed / Not Incorporated in Rhode Island is 4.7%.
What is the Percentage of Self-Employed / Not Incorporated in the United States?
Percentage of Self-Employed / Not Incorporated in the United States is 5.8%.