Cities with the Highest Percentage of Self-Employed / Not Incorporated in Nevada
RELATED REPORTS & OPTIONS
Self-Employed / Not Incorporated
Nevada
Compare Cities
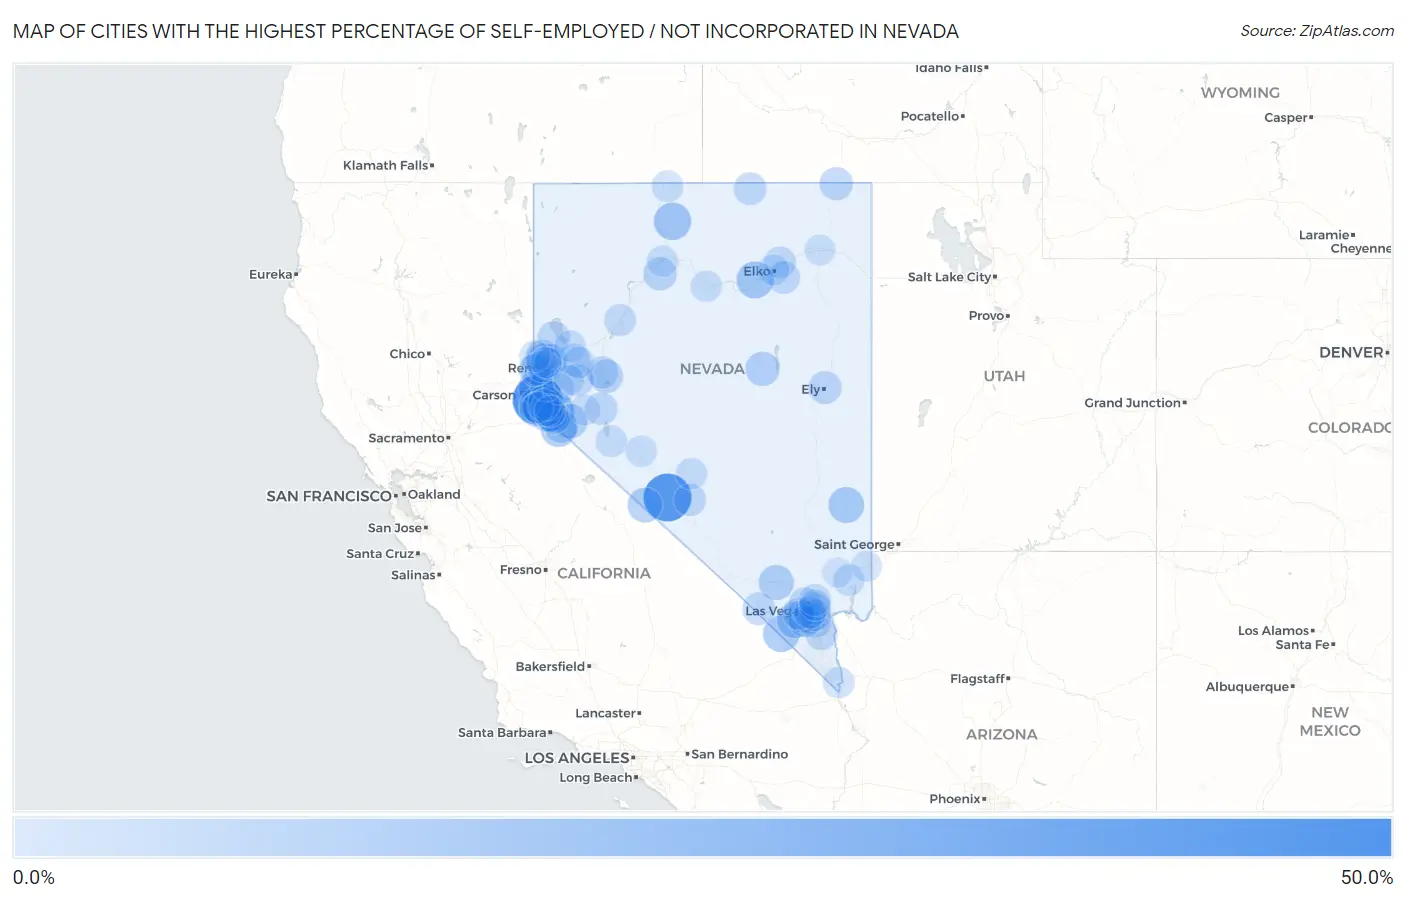
Map of Cities with the Highest Percentage of Self-Employed / Not Incorporated in Nevada
0.0%
50.0%
Cities with the Highest Percentage of Self-Employed / Not Incorporated in Nevada
| City | % Self-Employed / Not Incorporated | vs State | vs National | |
| 1. | Glenbrook | 48.0% | 5.3%(+42.7)#1 | 5.8%(+42.2)#261 |
| 2. | Silver Peak | 43.7% | 5.3%(+38.4)#2 | 5.8%(+37.9)#321 |
| 3. | Fish Springs | 25.1% | 5.3%(+19.8)#3 | 5.8%(+19.3)#933 |
| 4. | Amargosa Valley | 23.5% | 5.3%(+18.2)#4 | 5.8%(+17.7)#1,084 |
| 5. | Paradise Valley | 17.2% | 5.3%(+11.9)#5 | 5.8%(+11.4)#2,023 |
| 6. | Carlin | 16.4% | 5.3%(+11.1)#6 | 5.8%(+10.6)#2,238 |
| 7. | Skyland | 15.7% | 5.3%(+10.4)#7 | 5.8%(+9.93)#2,415 |
| 8. | Sandy Valley | 14.9% | 5.3%(+9.60)#8 | 5.8%(+9.11)#2,663 |
| 9. | Blue Diamond | 14.4% | 5.3%(+9.08)#9 | 5.8%(+8.58)#2,835 |
| 10. | Zephyr Cove | 14.2% | 5.3%(+8.91)#10 | 5.8%(+8.41)#2,911 |
| 11. | Topaz Lake | 14.1% | 5.3%(+8.77)#11 | 5.8%(+8.27)#2,957 |
| 12. | Caliente | 13.6% | 5.3%(+8.27)#12 | 5.8%(+7.77)#3,181 |
| 13. | Golden Valley | 12.8% | 5.3%(+7.49)#13 | 5.8%(+6.99)#3,547 |
| 14. | Indian Springs | 11.8% | 5.3%(+6.50)#14 | 5.8%(+6.00)#4,133 |
| 15. | Dyer | 11.1% | 5.3%(+5.80)#15 | 5.8%(+5.30)#4,588 |
| 16. | Incline Village | 11.1% | 5.3%(+5.77)#16 | 5.8%(+5.27)#4,628 |
| 17. | Smith Valley | 10.7% | 5.3%(+5.40)#17 | 5.8%(+4.90)#4,910 |
| 18. | Kingsbury | 9.9% | 5.3%(+4.56)#18 | 5.8%(+4.06)#5,673 |
| 19. | Eureka | 9.8% | 5.3%(+4.50)#19 | 5.8%(+4.00)#5,731 |
| 20. | Gardnerville Ranchos | 8.9% | 5.3%(+3.60)#20 | 5.8%(+3.10)#6,725 |
| 21. | Gardnerville | 8.6% | 5.3%(+3.31)#21 | 5.8%(+2.81)#7,077 |
| 22. | Fallon Station | 8.2% | 5.3%(+2.90)#22 | 5.8%(+2.40)#7,655 |
| 23. | Topaz Ranch Estates | 8.0% | 5.3%(+2.68)#23 | 5.8%(+2.18)#8,000 |
| 24. | Grass Valley | 7.9% | 5.3%(+2.55)#24 | 5.8%(+2.05)#8,185 |
| 25. | Lemmon Valley | 7.4% | 5.3%(+2.12)#25 | 5.8%(+1.62)#8,919 |
| 26. | Stateline | 7.4% | 5.3%(+2.11)#26 | 5.8%(+1.61)#8,952 |
| 27. | Jackpot | 7.4% | 5.3%(+2.06)#27 | 5.8%(+1.56)#9,042 |
| 28. | Ruhenstroth | 7.2% | 5.3%(+1.88)#28 | 5.8%(+1.38)#9,345 |
| 29. | Indian Hills | 7.0% | 5.3%(+1.72)#29 | 5.8%(+1.22)#9,664 |
| 30. | Ely | 7.0% | 5.3%(+1.70)#30 | 5.8%(+1.20)#9,714 |
| 31. | Mogul | 6.6% | 5.3%(+1.30)#31 | 5.8%(+0.802)#10,553 |
| 32. | Johnson Lane | 6.5% | 5.3%(+1.20)#32 | 5.8%(+0.698)#10,799 |
| 33. | Carson | 6.2% | 5.3%(+0.899)#33 | 5.8%(+0.399)#11,490 |
| 34. | Owyhee | 6.1% | 5.3%(+0.745)#34 | 5.8%(+0.245)#11,862 |
| 35. | Pahrump | 6.0% | 5.3%(+0.723)#35 | 5.8%(+0.223)#11,918 |
| 36. | Sutcliffe | 6.0% | 5.3%(+0.667)#36 | 5.8%(+0.167)#12,074 |
| 37. | Wadsworth | 6.0% | 5.3%(+0.654)#37 | 5.8%(+0.155)#12,108 |
| 38. | Carter Springs | 6.0% | 5.3%(+0.647)#38 | 5.8%(+0.148)#12,127 |
| 39. | Spring Creek | 5.8% | 5.3%(+0.491)#39 | 5.8%(-0.008)#12,514 |
| 40. | Henderson | 5.8% | 5.3%(+0.491)#40 | 5.8%(-0.009)#12,518 |
| 41. | Silver Springs | 5.8% | 5.3%(+0.476)#41 | 5.8%(-0.024)#12,558 |
| 42. | Las Vegas | 5.7% | 5.3%(+0.411)#42 | 5.8%(-0.089)#12,727 |
| 43. | Schurz | 5.6% | 5.3%(+0.298)#43 | 5.8%(-0.202)#13,031 |
| 44. | Spanish Springs | 5.6% | 5.3%(+0.257)#44 | 5.8%(-0.243)#13,133 |
| 45. | Spring Valley | 5.6% | 5.3%(+0.246)#45 | 5.8%(-0.253)#13,160 |
| 46. | Minden | 5.4% | 5.3%(+0.120)#46 | 5.8%(-0.380)#13,561 |
| 47. | Washoe Valley | 5.4% | 5.3%(+0.080)#47 | 5.8%(-0.420)#13,667 |
| 48. | Paradise | 5.4% | 5.3%(+0.078)#48 | 5.8%(-0.422)#13,673 |
| 49. | Verdi | 5.4% | 5.3%(+0.041)#49 | 5.8%(-0.458)#13,768 |
| 50. | Boulder City | 5.3% | 5.3%(+0.022)#50 | 5.8%(-0.478)#13,828 |
| 51. | Sunrise Manor | 5.2% | 5.3%(-0.135)#51 | 5.8%(-0.634)#14,281 |
| 52. | Enterprise | 5.1% | 5.3%(-0.185)#52 | 5.8%(-0.684)#14,431 |
| 53. | Goldfield | 5.0% | 5.3%(-0.316)#53 | 5.8%(-0.816)#14,842 |
| 54. | Whitney | 4.9% | 5.3%(-0.378)#54 | 5.8%(-0.878)#15,033 |
| 55. | Fallon | 4.8% | 5.3%(-0.519)#55 | 5.8%(-1.02)#15,463 |
| 56. | Summerlin South | 4.8% | 5.3%(-0.543)#56 | 5.8%(-1.04)#15,533 |
| 57. | Osino | 4.7% | 5.3%(-0.623)#57 | 5.8%(-1.12)#15,767 |
| 58. | Winchester | 4.7% | 5.3%(-0.640)#58 | 5.8%(-1.14)#15,822 |
| 59. | Lovelock | 4.6% | 5.3%(-0.689)#59 | 5.8%(-1.19)#15,992 |
| 60. | North Las Vegas | 4.5% | 5.3%(-0.818)#60 | 5.8%(-1.32)#16,426 |
| 61. | Reno | 4.4% | 5.3%(-0.867)#61 | 5.8%(-1.37)#16,583 |
| 62. | Genoa | 4.2% | 5.3%(-1.14)#62 | 5.8%(-1.64)#17,450 |
| 63. | Sparks | 4.0% | 5.3%(-1.30)#63 | 5.8%(-1.80)#17,998 |
| 64. | Nixon | 3.9% | 5.3%(-1.42)#64 | 5.8%(-1.92)#18,378 |
| 65. | Dayton | 3.8% | 5.3%(-1.48)#65 | 5.8%(-1.98)#18,572 |
| 66. | Fort Mcdermitt | 3.7% | 5.3%(-1.61)#66 | 5.8%(-2.11)#18,997 |
| 67. | Fernley | 3.4% | 5.3%(-1.93)#67 | 5.8%(-2.43)#20,044 |
| 68. | Tonopah | 3.4% | 5.3%(-1.94)#68 | 5.8%(-2.44)#20,056 |
| 69. | Moapa Valley | 3.3% | 5.3%(-1.99)#69 | 5.8%(-2.49)#20,219 |
| 70. | Laughlin | 3.3% | 5.3%(-2.04)#70 | 5.8%(-2.54)#20,362 |
| 71. | Hawthorne | 3.2% | 5.3%(-2.09)#71 | 5.8%(-2.59)#20,519 |
| 72. | Nellis Afb | 3.1% | 5.3%(-2.25)#72 | 5.8%(-2.75)#20,969 |
| 73. | Cold Springs | 3.0% | 5.3%(-2.33)#73 | 5.8%(-2.83)#21,213 |
| 74. | Sun Valley | 3.0% | 5.3%(-2.33)#74 | 5.8%(-2.83)#21,215 |
| 75. | Elko | 3.0% | 5.3%(-2.36)#75 | 5.8%(-2.86)#21,332 |
| 76. | Winnemucca | 2.9% | 5.3%(-2.40)#76 | 5.8%(-2.90)#21,441 |
| 77. | Round Hill Village | 2.9% | 5.3%(-2.44)#77 | 5.8%(-2.94)#21,530 |
| 78. | Mina | 2.9% | 5.3%(-2.46)#78 | 5.8%(-2.96)#21,597 |
| 79. | Battle Mountain | 2.8% | 5.3%(-2.54)#79 | 5.8%(-3.04)#21,783 |
| 80. | East Valley | 2.4% | 5.3%(-2.96)#80 | 5.8%(-3.46)#22,865 |
| 81. | Yerington | 2.3% | 5.3%(-3.03)#81 | 5.8%(-3.53)#23,040 |
| 82. | Mesquite | 2.0% | 5.3%(-3.28)#82 | 5.8%(-3.78)#23,625 |
| 83. | Wells | 1.8% | 5.3%(-3.53)#83 | 5.8%(-4.03)#24,102 |
| 84. | Stagecoach | 1.1% | 5.3%(-4.23)#84 | 5.8%(-4.73)#25,261 |
| 85. | Moapa Town | 0.37% | 5.3%(-4.94)#85 | 5.8%(-5.44)#25,962 |
1
2Common Questions
What are the Top 10 Cities with the Highest Percentage of Self-Employed / Not Incorporated in Nevada?
Top 10 Cities with the Highest Percentage of Self-Employed / Not Incorporated in Nevada are:
#1
48.0%
#2
43.7%
#3
25.1%
#4
17.2%
#5
16.4%
#6
15.7%
#7
14.9%
#8
14.4%
#9
14.2%
#10
14.1%
What city has the Highest Percentage of Self-Employed / Not Incorporated in Nevada?
Glenbrook has the Highest Percentage of Self-Employed / Not Incorporated in Nevada with 48.0%.
What is the Percentage of Self-Employed / Not Incorporated in the State of Nevada?
Percentage of Self-Employed / Not Incorporated in Nevada is 5.3%.
What is the Percentage of Self-Employed / Not Incorporated in the United States?
Percentage of Self-Employed / Not Incorporated in the United States is 5.8%.