Cities with the Highest Percentage of Self-Employed / Not Incorporated in Vermont
RELATED REPORTS & OPTIONS
Self-Employed / Not Incorporated
Vermont
Compare Cities
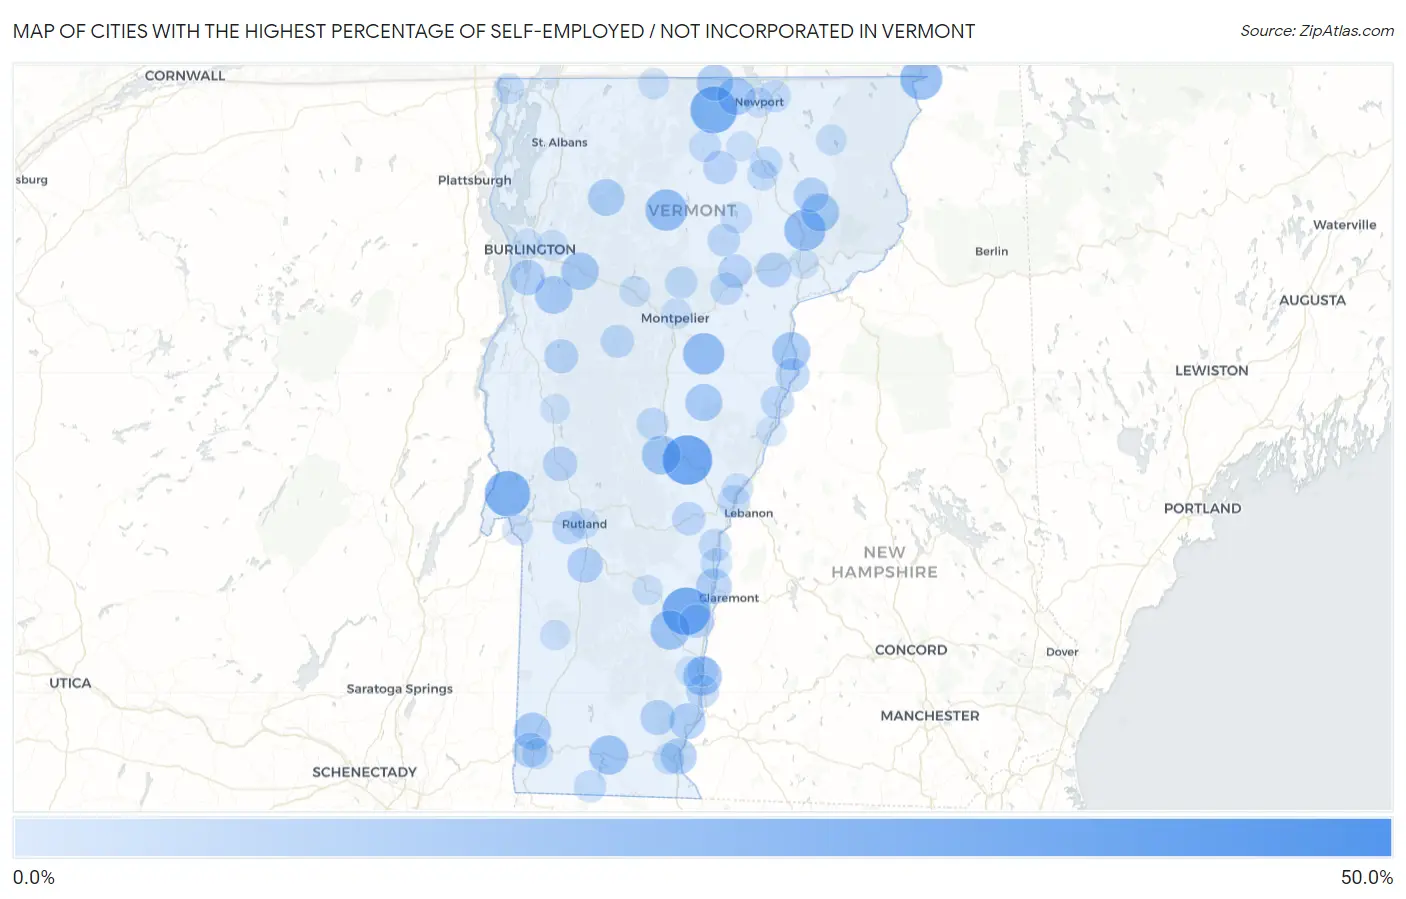
Map of Cities with the Highest Percentage of Self-Employed / Not Incorporated in Vermont
0.0%
50.0%
Cities with the Highest Percentage of Self-Employed / Not Incorporated in Vermont
| City | % Self-Employed / Not Incorporated | vs State | vs National | |
| 1. | Jamaica | 46.4% | 8.3%(+38.1)#1 | 5.8%(+40.6)#279 |
| 2. | South Royalton | 34.8% | 8.3%(+26.4)#2 | 5.8%(+28.9)#489 |
| 3. | North Springfield | 31.9% | 8.3%(+23.6)#3 | 5.8%(+26.1)#574 |
| 4. | Peacham | 31.1% | 8.3%(+22.8)#4 | 5.8%(+25.3)#598 |
| 5. | Troy | 30.5% | 8.3%(+22.2)#5 | 5.8%(+24.7)#622 |
| 6. | Benson | 28.4% | 8.3%(+20.1)#6 | 5.8%(+22.6)#730 |
| 7. | Beecher Falls | 23.1% | 8.3%(+14.8)#7 | 5.8%(+17.3)#1,127 |
| 8. | Grafton | 22.2% | 8.3%(+13.9)#8 | 5.8%(+16.4)#1,220 |
| 9. | East Barre | 22.1% | 8.3%(+13.7)#9 | 5.8%(+16.3)#1,237 |
| 10. | Lyndonville | 22.1% | 8.3%(+13.7)#10 | 5.8%(+16.3)#1,239 |
| 11. | Hyde Park | 22.1% | 8.3%(+13.7)#11 | 5.8%(+16.3)#1,240 |
| 12. | Chittenden | 19.6% | 8.3%(+11.3)#12 | 5.8%(+13.8)#1,576 |
| 13. | Wilmington | 18.8% | 8.3%(+10.5)#13 | 5.8%(+13.0)#1,698 |
| 14. | Chester | 18.8% | 8.3%(+10.5)#14 | 5.8%(+13.0)#1,703 |
| 15. | Bethel | 18.2% | 8.3%(+9.88)#15 | 5.8%(+12.4)#1,811 |
| 16. | North Westminster | 17.9% | 8.3%(+9.53)#16 | 5.8%(+12.0)#1,884 |
| 17. | Whitingham | 17.4% | 8.3%(+9.07)#17 | 5.8%(+11.6)#1,989 |
| 18. | Wells River | 17.1% | 8.3%(+8.77)#18 | 5.8%(+11.3)#2,064 |
| 19. | East Burke | 16.9% | 8.3%(+8.54)#19 | 5.8%(+11.1)#2,103 |
| 20. | Newport Center | 16.3% | 8.3%(+7.98)#20 | 5.8%(+10.5)#2,258 |
| 21. | Hinesburg | 16.1% | 8.3%(+7.81)#21 | 5.8%(+10.3)#2,298 |
| 22. | Richmond | 15.9% | 8.3%(+7.59)#22 | 5.8%(+10.1)#2,359 |
| 23. | South Shaftsbury | 15.6% | 8.3%(+7.26)#23 | 5.8%(+9.77)#2,445 |
| 24. | Chelsea | 15.3% | 8.3%(+6.98)#24 | 5.8%(+9.48)#2,545 |
| 25. | North Troy | 14.8% | 8.3%(+6.50)#25 | 5.8%(+9.01)#2,698 |
| 26. | Cambridge | 14.8% | 8.3%(+6.49)#26 | 5.8%(+9.00)#2,703 |
| 27. | Harmonyville | 14.6% | 8.3%(+6.32)#27 | 5.8%(+8.83)#2,758 |
| 28. | Putney | 13.9% | 8.3%(+5.59)#28 | 5.8%(+8.10)#3,032 |
| 29. | Brattleboro | 13.8% | 8.3%(+5.52)#29 | 5.8%(+8.03)#3,067 |
| 30. | Ascutney | 13.2% | 8.3%(+4.87)#30 | 5.8%(+7.38)#3,366 |
| 31. | Middletown Springs | 13.2% | 8.3%(+4.83)#31 | 5.8%(+7.34)#3,383 |
| 32. | Shelburne | 12.9% | 8.3%(+4.59)#32 | 5.8%(+7.10)#3,492 |
| 33. | Wallingford | 12.9% | 8.3%(+4.57)#33 | 5.8%(+7.08)#3,509 |
| 34. | Newfane | 12.3% | 8.3%(+3.96)#34 | 5.8%(+6.47)#3,848 |
| 35. | Old Bennington | 12.0% | 8.3%(+3.72)#35 | 5.8%(+6.23)#3,990 |
| 36. | Danville | 11.9% | 8.3%(+3.62)#36 | 5.8%(+6.13)#4,052 |
| 37. | West Burke | 11.9% | 8.3%(+3.61)#37 | 5.8%(+6.12)#4,060 |
| 38. | Sutton | 11.8% | 8.3%(+3.50)#38 | 5.8%(+6.01)#4,116 |
| 39. | Lincoln | 11.4% | 8.3%(+3.06)#39 | 5.8%(+5.57)#4,424 |
| 40. | Brandon | 11.3% | 8.3%(+3.01)#40 | 5.8%(+5.52)#4,450 |
| 41. | Hartford | 11.1% | 8.3%(+2.73)#41 | 5.8%(+5.24)#4,656 |
| 42. | North Hyde Park | 10.9% | 8.3%(+2.61)#42 | 5.8%(+5.12)#4,745 |
| 43. | Bristol | 10.9% | 8.3%(+2.54)#43 | 5.8%(+5.05)#4,795 |
| 44. | Newbury | 10.8% | 8.3%(+2.47)#44 | 5.8%(+4.98)#4,850 |
| 45. | Sheffield | 10.4% | 8.3%(+2.09)#45 | 5.8%(+4.60)#5,172 |
| 46. | Pownal Center | 10.4% | 8.3%(+2.06)#46 | 5.8%(+4.57)#5,190 |
| 47. | Springfield | 10.3% | 8.3%(+2.01)#47 | 5.8%(+4.52)#5,244 |
| 48. | Albany | 10.2% | 8.3%(+1.88)#48 | 5.8%(+4.39)#5,352 |
| 49. | Waterbury Center | 10.1% | 8.3%(+1.78)#49 | 5.8%(+4.29)#5,435 |
| 50. | Cabot | 10.1% | 8.3%(+1.77)#50 | 5.8%(+4.28)#5,442 |
| 51. | West Rutland | 9.9% | 8.3%(+1.55)#51 | 5.8%(+4.06)#5,664 |
| 52. | Killington | 9.8% | 8.3%(+1.51)#52 | 5.8%(+4.02)#5,714 |
| 53. | Woodstock | 9.8% | 8.3%(+1.47)#53 | 5.8%(+3.98)#5,746 |
| 54. | Bradford | 9.7% | 8.3%(+1.42)#54 | 5.8%(+3.93)#5,824 |
| 55. | Waitsfield | 9.6% | 8.3%(+1.25)#55 | 5.8%(+3.76)#6,007 |
| 56. | East Dorset | 9.5% | 8.3%(+1.14)#56 | 5.8%(+3.65)#6,122 |
| 57. | Stamford | 9.0% | 8.3%(+0.687)#57 | 5.8%(+3.20)#6,615 |
| 58. | Westminster | 8.9% | 8.3%(+0.597)#58 | 5.8%(+3.11)#6,715 |
| 59. | Hardwick | 8.9% | 8.3%(+0.542)#59 | 5.8%(+3.05)#6,780 |
| 60. | Marshfield | 8.6% | 8.3%(+0.323)#60 | 5.8%(+2.83)#7,043 |
| 61. | Wilder | 8.5% | 8.3%(+0.216)#61 | 5.8%(+2.73)#7,190 |
| 62. | New Haven | 8.4% | 8.3%(+0.072)#62 | 5.8%(+2.58)#7,392 |
| 63. | Randolph | 8.4% | 8.3%(+0.031)#63 | 5.8%(+2.54)#7,444 |
| 64. | Hartland | 8.3% | 8.3%(+0.008)#64 | 5.8%(+2.52)#7,479 |
| 65. | St. George | 8.1% | 8.3%(-0.191)#65 | 5.8%(+2.32)#7,776 |
| 66. | Worcester | 8.1% | 8.3%(-0.217)#66 | 5.8%(+2.29)#7,826 |
| 67. | Lowell | 8.0% | 8.3%(-0.371)#67 | 5.8%(+2.14)#8,047 |
| 68. | Barton | 7.9% | 8.3%(-0.376)#68 | 5.8%(+2.13)#8,051 |
| 69. | Readsboro | 7.9% | 8.3%(-0.389)#69 | 5.8%(+2.12)#8,070 |
| 70. | Derby Center | 7.8% | 8.3%(-0.517)#70 | 5.8%(+1.99)#8,278 |
| 71. | Greensboro | 7.3% | 8.3%(-1.01)#71 | 5.8%(+1.50)#9,151 |
| 72. | Windsor | 7.2% | 8.3%(-1.09)#72 | 5.8%(+1.42)#9,279 |
| 73. | Algiers | 7.1% | 8.3%(-1.23)#73 | 5.8%(+1.28)#9,557 |
| 74. | West Brattleboro | 6.8% | 8.3%(-1.53)#74 | 5.8%(+0.985)#10,153 |
| 75. | Bennington | 6.6% | 8.3%(-1.74)#75 | 5.8%(+0.765)#10,636 |
| 76. | Rutland | 6.6% | 8.3%(-1.76)#76 | 5.8%(+0.750)#10,665 |
| 77. | Proctor | 6.5% | 8.3%(-1.80)#77 | 5.8%(+0.712)#10,751 |
| 78. | Bellows Falls | 6.5% | 8.3%(-1.86)#78 | 5.8%(+0.647)#10,914 |
| 79. | Richford | 6.5% | 8.3%(-1.87)#79 | 5.8%(+0.636)#10,933 |
| 80. | Alburgh | 6.4% | 8.3%(-1.90)#80 | 5.8%(+0.606)#11,009 |
| 81. | Norwich | 6.3% | 8.3%(-1.98)#81 | 5.8%(+0.534)#11,164 |
| 82. | Lunenburg | 6.3% | 8.3%(-2.03)#82 | 5.8%(+0.484)#11,279 |
| 83. | Waterbury | 6.3% | 8.3%(-2.07)#83 | 5.8%(+0.442)#11,372 |
| 84. | West Charlotte | 6.2% | 8.3%(-2.12)#84 | 5.8%(+0.386)#11,522 |
| 85. | Glover | 6.2% | 8.3%(-2.17)#85 | 5.8%(+0.338)#11,632 |
| 86. | Fair Haven | 6.1% | 8.3%(-2.25)#86 | 5.8%(+0.255)#11,838 |
| 87. | Island Pond | 6.0% | 8.3%(-2.31)#87 | 5.8%(+0.197)#11,992 |
| 88. | Montpelier | 5.9% | 8.3%(-2.47)#88 | 5.8%(+0.035)#12,414 |
| 89. | Essex Junction | 5.6% | 8.3%(-2.73)#89 | 5.8%(-0.221)#13,085 |
| 90. | Castleton Four Corners | 5.4% | 8.3%(-2.88)#90 | 5.8%(-0.366)#13,524 |
| 91. | Dorset | 5.3% | 8.3%(-2.98)#91 | 5.8%(-0.472)#13,816 |
| 92. | Newport | 5.3% | 8.3%(-3.05)#92 | 5.8%(-0.541)#13,993 |
| 93. | Ludlow | 5.3% | 8.3%(-3.06)#93 | 5.8%(-0.552)#14,026 |
| 94. | Fairlee | 5.2% | 8.3%(-3.15)#94 | 5.8%(-0.643)#14,312 |
| 95. | St Johnsbury | 5.1% | 8.3%(-3.19)#95 | 5.8%(-0.685)#14,432 |
| 96. | Saxtons River | 5.1% | 8.3%(-3.20)#96 | 5.8%(-0.695)#14,472 |
| 97. | Danby | 5.1% | 8.3%(-3.22)#97 | 5.8%(-0.714)#14,524 |
| 98. | Irasburg | 5.0% | 8.3%(-3.33)#98 | 5.8%(-0.816)#14,844 |
| 99. | Burlington | 5.0% | 8.3%(-3.35)#99 | 5.8%(-0.837)#14,902 |
| 100. | East Middlebury | 4.9% | 8.3%(-3.43)#100 | 5.8%(-0.920)#15,160 |
1
2Common Questions
What are the Top 10 Cities with the Highest Percentage of Self-Employed / Not Incorporated in Vermont?
Top 10 Cities with the Highest Percentage of Self-Employed / Not Incorporated in Vermont are:
#1
34.8%
#2
31.9%
#3
30.5%
#4
28.4%
#5
23.1%
#6
22.1%
#7
22.1%
#8
22.1%
#9
18.8%
#10
18.8%
What city has the Highest Percentage of Self-Employed / Not Incorporated in Vermont?
South Royalton has the Highest Percentage of Self-Employed / Not Incorporated in Vermont with 34.8%.
What is the Percentage of Self-Employed / Not Incorporated in the State of Vermont?
Percentage of Self-Employed / Not Incorporated in Vermont is 8.3%.
What is the Percentage of Self-Employed / Not Incorporated in the United States?
Percentage of Self-Employed / Not Incorporated in the United States is 5.8%.