Cities with the Highest Percentage of Self-Employed / Not Incorporated in Colorado
RELATED REPORTS & OPTIONS
Self-Employed / Not Incorporated
Colorado
Compare Cities
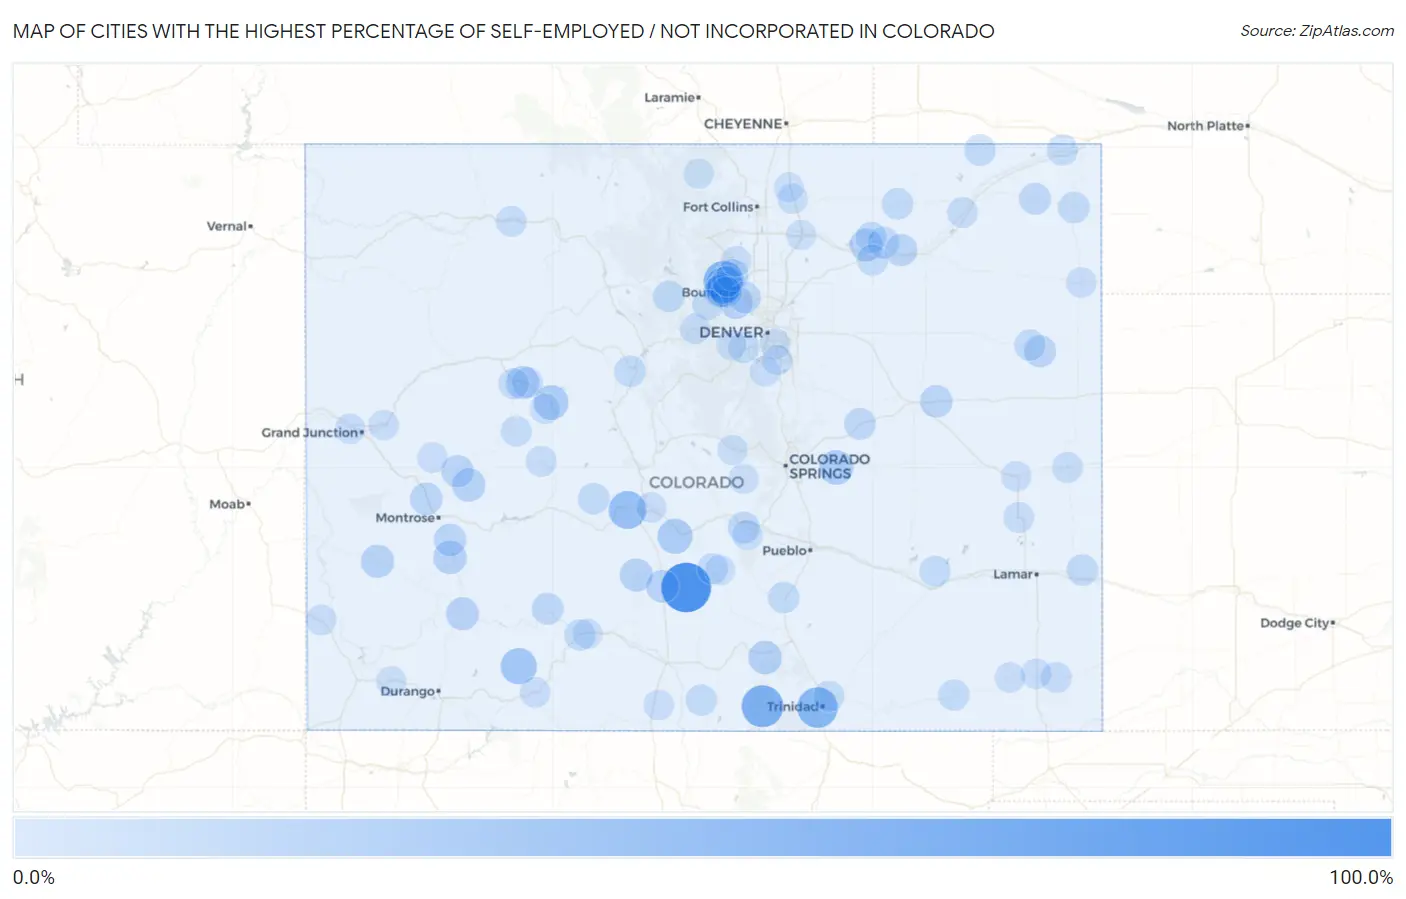
Map of Cities with the Highest Percentage of Self-Employed / Not Incorporated in Colorado
0.0%
100.0%
Cities with the Highest Percentage of Self-Employed / Not Incorporated in Colorado
| City | % Self-Employed / Not Incorporated | vs State | vs National | |
| 1. | Crestone | 100.0% | 6.1%(+93.9)#1 | 5.8%(+94.2)#35 |
| 2. | Cope | 75.0% | 6.1%(+68.9)#2 | 5.8%(+69.2)#99 |
| 3. | Stonewall Gap | 63.6% | 6.1%(+57.5)#3 | 5.8%(+57.8)#130 |
| 4. | Jansen | 57.1% | 6.1%(+51.0)#4 | 5.8%(+51.3)#169 |
| 5. | Glendale | 57.1% | 6.1%(+51.0)#5 | 5.8%(+51.3)#170 |
| 6. | Maysville | 44.6% | 6.1%(+38.5)#6 | 5.8%(+38.7)#301 |
| 7. | Sunshine | 40.0% | 6.1%(+33.9)#7 | 5.8%(+34.2)#378 |
| 8. | Piedra | 37.5% | 6.1%(+31.4)#8 | 5.8%(+31.7)#430 |
| 9. | Blue Valley | 36.4% | 6.1%(+30.3)#9 | 5.8%(+30.5)#452 |
| 10. | Coaldale | 32.4% | 6.1%(+26.3)#10 | 5.8%(+26.6)#561 |
| 11. | Woody Creek | 30.6% | 6.1%(+24.5)#11 | 5.8%(+24.8)#615 |
| 12. | Ellicott | 30.4% | 6.1%(+24.3)#12 | 5.8%(+24.6)#629 |
| 13. | La Veta | 25.9% | 6.1%(+19.8)#13 | 5.8%(+20.1)#889 |
| 14. | Mountain Meadows | 25.5% | 6.1%(+19.4)#14 | 5.8%(+19.7)#914 |
| 15. | Loghill Village | 25.0% | 6.1%(+18.9)#15 | 5.8%(+19.2)#940 |
| 16. | Crawford | 24.3% | 6.1%(+18.3)#16 | 5.8%(+18.5)#1,007 |
| 17. | Catherine | 24.2% | 6.1%(+18.1)#17 | 5.8%(+18.3)#1,020 |
| 18. | Redvale | 24.0% | 6.1%(+17.9)#18 | 5.8%(+18.2)#1,042 |
| 19. | Saguache | 23.6% | 6.1%(+17.5)#19 | 5.8%(+17.8)#1,066 |
| 20. | Orchard | 23.5% | 6.1%(+17.4)#20 | 5.8%(+17.7)#1,074 |
| 21. | Eldorado Springs | 22.8% | 6.1%(+16.7)#21 | 5.8%(+16.9)#1,155 |
| 22. | Silverton | 22.7% | 6.1%(+16.6)#22 | 5.8%(+16.9)#1,157 |
| 23. | Moffat | 22.2% | 6.1%(+16.1)#23 | 5.8%(+16.4)#1,225 |
| 24. | Crisman | 21.5% | 6.1%(+15.4)#24 | 5.8%(+15.7)#1,294 |
| 25. | Olathe | 21.3% | 6.1%(+15.2)#25 | 5.8%(+15.4)#1,332 |
| 26. | Colona | 21.2% | 6.1%(+15.1)#26 | 5.8%(+15.4)#1,344 |
| 27. | Sugarloaf | 21.1% | 6.1%(+15.0)#27 | 5.8%(+15.3)#1,361 |
| 28. | Genoa | 21.0% | 6.1%(+14.9)#28 | 5.8%(+15.2)#1,379 |
| 29. | Hotchkiss | 20.9% | 6.1%(+14.8)#29 | 5.8%(+15.1)#1,388 |
| 30. | Blue Sky | 20.4% | 6.1%(+14.3)#30 | 5.8%(+14.6)#1,451 |
| 31. | Kirk | 19.5% | 6.1%(+13.4)#31 | 5.8%(+13.7)#1,592 |
| 32. | Brook Forest | 19.0% | 6.1%(+12.9)#32 | 5.8%(+13.1)#1,681 |
| 33. | Haxtun | 18.5% | 6.1%(+12.4)#33 | 5.8%(+12.7)#1,753 |
| 34. | City Of Creede | 18.5% | 6.1%(+12.4)#34 | 5.8%(+12.7)#1,762 |
| 35. | Brookside | 18.3% | 6.1%(+12.3)#35 | 5.8%(+12.5)#1,789 |
| 36. | Altona | 18.0% | 6.1%(+11.9)#36 | 5.8%(+12.2)#1,849 |
| 37. | Paragon Estates | 17.7% | 6.1%(+11.6)#37 | 5.8%(+11.9)#1,921 |
| 38. | Ramah | 17.6% | 6.1%(+11.5)#38 | 5.8%(+11.8)#1,935 |
| 39. | Colorado City | 17.3% | 6.1%(+11.2)#39 | 5.8%(+11.5)#1,999 |
| 40. | Peetz | 17.1% | 6.1%(+11.0)#40 | 5.8%(+11.3)#2,071 |
| 41. | Weldona | 17.0% | 6.1%(+10.9)#41 | 5.8%(+11.2)#2,076 |
| 42. | Tabernash | 17.0% | 6.1%(+10.9)#42 | 5.8%(+11.2)#2,078 |
| 43. | Pitkin | 17.0% | 6.1%(+10.9)#43 | 5.8%(+11.2)#2,085 |
| 44. | Holyoke | 16.7% | 6.1%(+10.6)#44 | 5.8%(+10.9)#2,125 |
| 45. | Raymer New Raymer | 16.7% | 6.1%(+10.6)#45 | 5.8%(+10.9)#2,153 |
| 46. | Hartman | 16.7% | 6.1%(+10.6)#46 | 5.8%(+10.9)#2,162 |
| 47. | Copper Mountain | 16.6% | 6.1%(+10.5)#47 | 5.8%(+10.8)#2,185 |
| 48. | Jackson Lake | 16.4% | 6.1%(+10.3)#48 | 5.8%(+10.6)#2,235 |
| 49. | Joes | 16.2% | 6.1%(+10.1)#49 | 5.8%(+10.4)#2,282 |
| 50. | San Acacio | 16.0% | 6.1%(+9.90)#50 | 5.8%(+10.2)#2,336 |
| 51. | Wiggins | 16.0% | 6.1%(+9.86)#51 | 5.8%(+10.1)#2,345 |
| 52. | South Fork | 16.0% | 6.1%(+9.85)#52 | 5.8%(+10.1)#2,348 |
| 53. | Cheraw | 15.6% | 6.1%(+9.46)#53 | 5.8%(+9.74)#2,463 |
| 54. | Pine Valley | 15.4% | 6.1%(+9.33)#54 | 5.8%(+9.62)#2,495 |
| 55. | Tall Timber | 15.4% | 6.1%(+9.29)#55 | 5.8%(+9.57)#2,508 |
| 56. | Ovid | 15.4% | 6.1%(+9.29)#56 | 5.8%(+9.57)#2,509 |
| 57. | Morrison | 15.3% | 6.1%(+9.23)#57 | 5.8%(+9.51)#2,537 |
| 58. | Kim | 15.0% | 6.1%(+8.90)#58 | 5.8%(+9.18)#2,641 |
| 59. | El Moro | 14.7% | 6.1%(+8.63)#59 | 5.8%(+8.91)#2,734 |
| 60. | Westcliffe | 14.7% | 6.1%(+8.58)#60 | 5.8%(+8.86)#2,751 |
| 61. | Vilas | 14.6% | 6.1%(+8.49)#61 | 5.8%(+8.77)#2,782 |
| 62. | El Jebel | 14.3% | 6.1%(+8.19)#62 | 5.8%(+8.48)#2,862 |
| 63. | Crested Butte | 14.1% | 6.1%(+8.01)#63 | 5.8%(+8.29)#2,947 |
| 64. | Lazy Acres | 14.1% | 6.1%(+7.98)#64 | 5.8%(+8.26)#2,962 |
| 65. | Carbondale | 13.8% | 6.1%(+7.74)#65 | 5.8%(+8.02)#3,069 |
| 66. | Cheyenne Wells | 13.8% | 6.1%(+7.74)#66 | 5.8%(+8.02)#3,070 |
| 67. | Marble | 13.7% | 6.1%(+7.63)#67 | 5.8%(+7.91)#3,121 |
| 68. | Eads | 13.6% | 6.1%(+7.48)#68 | 5.8%(+7.76)#3,184 |
| 69. | Atwood | 13.3% | 6.1%(+7.16)#69 | 5.8%(+7.44)#3,332 |
| 70. | Hayden | 13.2% | 6.1%(+7.13)#70 | 5.8%(+7.41)#3,345 |
| 71. | Cedaredge | 13.0% | 6.1%(+6.92)#71 | 5.8%(+7.20)#3,452 |
| 72. | Dove Creek | 13.0% | 6.1%(+6.86)#72 | 5.8%(+7.14)#3,473 |
| 73. | Rockvale | 12.9% | 6.1%(+6.84)#73 | 5.8%(+7.13)#3,479 |
| 74. | Pagosa Springs | 12.9% | 6.1%(+6.82)#74 | 5.8%(+7.10)#3,494 |
| 75. | Holly Hills | 12.8% | 6.1%(+6.68)#75 | 5.8%(+6.96)#3,567 |
| 76. | Manassa | 12.7% | 6.1%(+6.60)#76 | 5.8%(+6.88)#3,595 |
| 77. | Snowmass Village | 12.6% | 6.1%(+6.49)#77 | 5.8%(+6.77)#3,656 |
| 78. | Palisade | 12.6% | 6.1%(+6.47)#78 | 5.8%(+6.75)#3,664 |
| 79. | Lyons | 12.5% | 6.1%(+6.43)#79 | 5.8%(+6.71)#3,682 |
| 80. | Downieville Lawson Dumont | 12.5% | 6.1%(+6.40)#80 | 5.8%(+6.68)#3,697 |
| 81. | Louviers | 12.5% | 6.1%(+6.40)#81 | 5.8%(+6.68)#3,711 |
| 82. | Springfield | 12.4% | 6.1%(+6.33)#82 | 5.8%(+6.62)#3,768 |
| 83. | Smeltertown | 12.3% | 6.1%(+6.18)#83 | 5.8%(+6.47)#3,852 |
| 84. | Kit Carson | 12.1% | 6.1%(+6.02)#84 | 5.8%(+6.31)#3,942 |
| 85. | Pierce | 12.0% | 6.1%(+5.86)#85 | 5.8%(+6.14)#4,042 |
| 86. | Pritchett | 11.9% | 6.1%(+5.84)#86 | 5.8%(+6.12)#4,061 |
| 87. | Rollinsville | 11.9% | 6.1%(+5.78)#87 | 5.8%(+6.06)#4,091 |
| 88. | Redlands | 11.8% | 6.1%(+5.70)#88 | 5.8%(+5.98)#4,140 |
| 89. | Wray | 11.8% | 6.1%(+5.69)#89 | 5.8%(+5.98)#4,144 |
| 90. | Acres Green | 11.7% | 6.1%(+5.65)#90 | 5.8%(+5.93)#4,181 |
| 91. | Kittredge | 11.6% | 6.1%(+5.53)#91 | 5.8%(+5.81)#4,252 |
| 92. | Cripple Creek | 11.5% | 6.1%(+5.43)#92 | 5.8%(+5.71)#4,318 |
| 93. | Silver Cliff | 11.3% | 6.1%(+5.21)#93 | 5.8%(+5.50)#4,473 |
| 94. | Red Feather Lakes | 11.2% | 6.1%(+5.13)#94 | 5.8%(+5.42)#4,517 |
| 95. | Mancos | 11.1% | 6.1%(+5.03)#95 | 5.8%(+5.32)#4,574 |
| 96. | Florissant | 11.1% | 6.1%(+5.01)#96 | 5.8%(+5.30)#4,599 |
| 97. | Garden City | 11.1% | 6.1%(+5.01)#97 | 5.8%(+5.30)#4,600 |
| 98. | Upper Witter Gulch | 11.1% | 6.1%(+4.96)#98 | 5.8%(+5.24)#4,651 |
| 99. | Gerrard | 11.0% | 6.1%(+4.94)#99 | 5.8%(+5.22)#4,673 |
| 100. | Nunn | 11.0% | 6.1%(+4.86)#100 | 5.8%(+5.14)#4,726 |
Common Questions
What are the Top 10 Cities with the Highest Percentage of Self-Employed / Not Incorporated in Colorado?
Top 10 Cities with the Highest Percentage of Self-Employed / Not Incorporated in Colorado are:
#1
100.0%
#2
63.6%
#3
57.1%
#4
57.1%
#5
44.6%
#6
40.0%
#7
37.5%
#8
32.4%
#9
30.6%
#10
30.4%
What city has the Highest Percentage of Self-Employed / Not Incorporated in Colorado?
Crestone has the Highest Percentage of Self-Employed / Not Incorporated in Colorado with 100.0%.
What is the Percentage of Self-Employed / Not Incorporated in the State of Colorado?
Percentage of Self-Employed / Not Incorporated in Colorado is 6.1%.
What is the Percentage of Self-Employed / Not Incorporated in the United States?
Percentage of Self-Employed / Not Incorporated in the United States is 5.8%.