Cities with the Highest Percentage of Self-Employed / Not Incorporated in Alaska
RELATED REPORTS & OPTIONS
Self-Employed / Not Incorporated
Alaska
Compare Cities
Map of Cities with the Highest Percentage of Self-Employed / Not Incorporated in Alaska
0.0%
100.0%
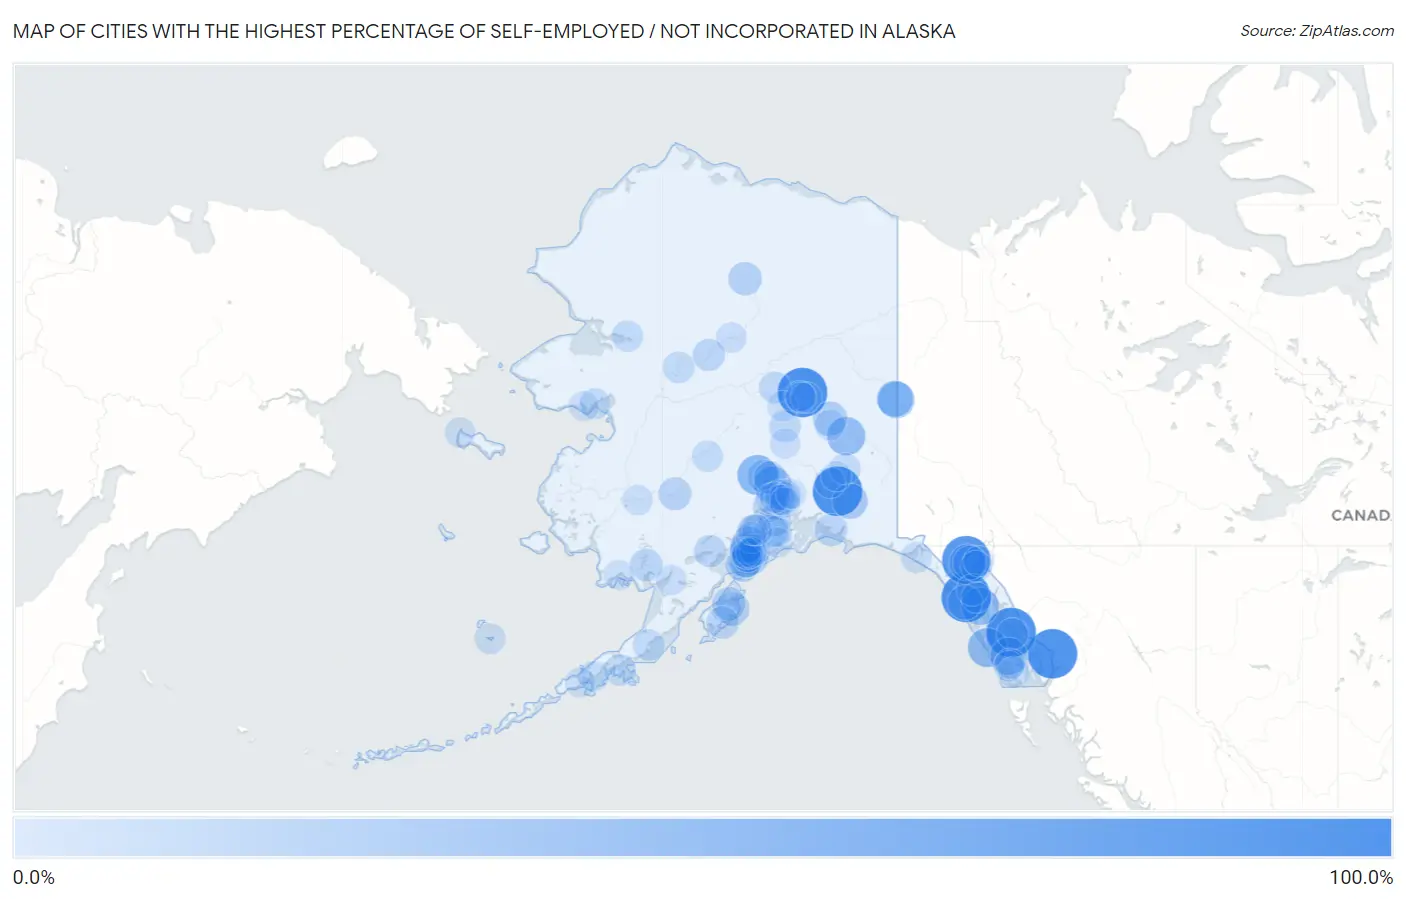
Cities with the Highest Percentage of Self-Employed / Not Incorporated in Alaska
| City | % Self-Employed / Not Incorporated | vs State | vs National | |
| 1. | Fox | 100.0% | 6.0% (+94.0)#1 | 5.8% (+94.2)#10 |
| 2. | Willow Creek | 100.0% | 6.0% (+94.0)#2 | 5.8% (+94.2)#15 |
| 3. | Hyder | 100.0% | 6.0% (+94.0)#4 | 5.8% (+94.2)#53 |
| 4. | Elfin Cove | 100.0% | 6.0% (+94.0)#5 | 5.8% (+94.2)#54 |
| 5. | Kupreanof | 100.0% | 6.0% (+94.0)#6 | 5.8% (+94.2)#60 |
| 6. | Mosquito Lake | 93.2% | 6.0% (+87.2)#7 | 5.8% (+87.4)#79 |
| 7. | Petersville | 53.8% | 6.0% (+47.9)#8 | 5.8% (+48.0)#198 |
| 8. | Port Alexander | 50.0% | 6.0% (+44.0)#9 | 5.8% (+44.2)#235 |
| 9. | Dry Creek | 45.5% | 6.0% (+39.5)#10 | 5.8% (+39.6)#291 |
| 10. | Susitna North | 43.4% | 6.0% (+37.4)#11 | 5.8% (+37.6)#323 |
| 11. | Tenakee Springs | 42.9% | 6.0% (+36.9)#12 | 5.8% (+37.0)#329 |
| 12. | Naukati Bay | 41.6% | 6.0% (+35.6)#13 | 5.8% (+35.7)#356 |
| 13. | Eagle Village | 37.5% | 6.0% (+31.5)#14 | 5.8% (+31.7)#426 |
| 14. | Covenant Life | 36.0% | 6.0% (+30.0)#15 | 5.8% (+30.2)#464 |
| 15. | Eagle | 34.6% | 6.0% (+28.6)#16 | 5.8% (+28.8)#495 |
| 16. | Chitina | 31.6% | 6.0% (+25.6)#17 | 5.8% (+25.8)#585 |
| 17. | Halibut Cove | 28.1% | 6.0% (+22.1)#18 | 5.8% (+22.3)#743 |
| 18. | Pelican | 27.8% | 6.0% (+21.8)#19 | 5.8% (+22.0)#761 |
| 19. | Big Delta | 27.3% | 6.0% (+21.3)#20 | 5.8% (+21.5)#792 |
| 20. | Ninilchik | 26.2% | 6.0% (+20.2)#21 | 5.8% (+20.4)#860 |
| 21. | Womens Bay | 25.1% | 6.0% (+19.1)#22 | 5.8% (+19.3)#936 |
| 22. | Klukwan | 24.0% | 6.0% (+18.0)#23 | 5.8% (+18.2)#1,041 |
| 23. | Kachemak | 23.9% | 6.0% (+18.0)#24 | 5.8% (+18.1)#1,044 |
| 24. | Nanwalek | 23.9% | 6.0% (+18.0)#25 | 5.8% (+18.1)#1,045 |
| 25. | Seldovia | 23.2% | 6.0% (+17.2)#26 | 5.8% (+17.4)#1,116 |
| 26. | Anaktuvuk Pass | 22.2% | 6.0% (+16.2)#27 | 5.8% (+16.4)#1,216 |
| 27. | Port Lions | 22.0% | 6.0% (+16.1)#28 | 5.8% (+16.2)#1,242 |
| 28. | Trapper Creek | 21.5% | 6.0% (+15.6)#29 | 5.8% (+15.7)#1,293 |
| 29. | Cooper Landing | 21.2% | 6.0% (+15.3)#30 | 5.8% (+15.4)#1,335 |
| 30. | Stony River | 20.0% | 6.0% (+14.0)#31 | 5.8% (+14.2)#1,522 |
| 31. | Nikolaevsk | 19.7% | 6.0% (+13.7)#32 | 5.8% (+13.9)#1,564 |
| 32. | Hope | 18.8% | 6.0% (+12.8)#33 | 5.8% (+12.9)#1,718 |
| 33. | Aleknagik | 18.8% | 6.0% (+12.8)#34 | 5.8% (+12.9)#1,719 |
| 34. | Cordova | 18.6% | 6.0% (+12.6)#35 | 5.8% (+12.8)#1,745 |
| 35. | Old Harbor | 18.5% | 6.0% (+12.5)#36 | 5.8% (+12.7)#1,757 |
| 36. | Talkeetna | 18.2% | 6.0% (+12.3)#37 | 5.8% (+12.4)#1,806 |
| 37. | Seldovia Village | 17.3% | 6.0% (+11.3)#38 | 5.8% (+11.5)#2,015 |
| 38. | Hughes | 16.7% | 6.0% (+10.7)#39 | 5.8% (+10.9)#2,165 |
| 39. | Pedro Bay | 16.7% | 6.0% (+10.7)#40 | 5.8% (+10.9)#2,174 |
| 40. | Happy Valley | 15.6% | 6.0% (+9.64)#41 | 5.8% (+9.81)#2,435 |
| 41. | Point Mackenzie | 15.5% | 6.0% (+9.55)#42 | 5.8% (+9.71)#2,468 |
| 42. | Minto | 15.4% | 6.0% (+9.40)#43 | 5.8% (+9.57)#2,519 |
| 43. | Healy | 15.1% | 6.0% (+9.13)#44 | 5.8% (+9.29)#2,603 |
| 44. | Sand Point | 14.4% | 6.0% (+8.44)#45 | 5.8% (+8.61)#2,824 |
| 45. | Chignik Lagoon | 14.3% | 6.0% (+8.30)#46 | 5.8% (+8.47)#2,896 |
| 46. | Huslia | 14.0% | 6.0% (+8.05)#47 | 5.8% (+8.22)#2,976 |
| 47. | Homer | 14.0% | 6.0% (+8.01)#48 | 5.8% (+8.18)#2,999 |
| 48. | Gustavus | 14.0% | 6.0% (+7.97)#49 | 5.8% (+8.14)#3,013 |
| 49. | Ridgeway | 13.2% | 6.0% (+7.24)#50 | 5.8% (+7.40)#3,348 |
| 50. | Hydaburg | 12.8% | 6.0% (+6.80)#51 | 5.8% (+6.97)#3,561 |
| 51. | Fox River | 12.7% | 6.0% (+6.74)#52 | 5.8% (+6.90)#3,588 |
| 52. | Selawik | 12.7% | 6.0% (+6.68)#53 | 5.8% (+6.84)#3,621 |
| 53. | Chistochina | 12.5% | 6.0% (+6.52)#54 | 5.8% (+6.68)#3,734 |
| 54. | Petersburg | 12.4% | 6.0% (+6.39)#55 | 5.8% (+6.56)#3,800 |
| 55. | Elim | 12.1% | 6.0% (+6.09)#56 | 5.8% (+6.25)#3,973 |
| 56. | Nikolai | 11.9% | 6.0% (+5.92)#57 | 5.8% (+6.09)#4,077 |
| 57. | Moose Pass | 11.8% | 6.0% (+5.78)#58 | 5.8% (+5.95)#4,165 |
| 58. | Haines | 11.4% | 6.0% (+5.42)#59 | 5.8% (+5.59)#4,404 |
| 59. | Houston | 11.3% | 6.0% (+5.27)#60 | 5.8% (+5.44)#4,498 |
| 60. | Mill Bay | 11.2% | 6.0% (+5.27)#61 | 5.8% (+5.43)#4,510 |
| 61. | Cohoe | 11.1% | 6.0% (+5.15)#62 | 5.8% (+5.32)#4,573 |
| 62. | Wrangell City And Borough | 11.0% | 6.0% (+5.05)#63 | 5.8% (+5.21)#4,677 |
| 63. | Yakutat | 11.0% | 6.0% (+5.03)#64 | 5.8% (+5.19)#4,691 |
| 64. | St George | 10.7% | 6.0% (+4.73)#65 | 5.8% (+4.90)#4,924 |
| 65. | Sitka City And Borough | 10.7% | 6.0% (+4.70)#66 | 5.8% (+4.87)#4,942 |
| 66. | Glennallen | 10.6% | 6.0% (+4.63)#67 | 5.8% (+4.80)#5,000 |
| 67. | Sutton Alpine | 10.5% | 6.0% (+4.50)#68 | 5.8% (+4.67)#5,107 |
| 68. | Fort Greely | 10.5% | 6.0% (+4.49)#69 | 5.8% (+4.66)#5,115 |
| 69. | Anchor Point | 10.0% | 6.0% (+4.01)#70 | 5.8% (+4.17)#5,564 |
| 70. | Diamond Ridge | 9.9% | 6.0% (+3.90)#71 | 5.8% (+4.06)#5,666 |
| 71. | Lazy Mountain | 9.7% | 6.0% (+3.77)#72 | 5.8% (+3.93)#5,814 |
| 72. | Allakaket | 9.7% | 6.0% (+3.74)#73 | 5.8% (+3.91)#5,856 |
| 73. | Nenana | 9.4% | 6.0% (+3.44)#74 | 5.8% (+3.60)#6,167 |
| 74. | Cantwell | 9.4% | 6.0% (+3.39)#75 | 5.8% (+3.56)#6,199 |
| 75. | Chuathbaluk | 9.4% | 6.0% (+3.39)#76 | 5.8% (+3.56)#6,200 |
| 76. | Butte | 9.4% | 6.0% (+3.38)#77 | 5.8% (+3.54)#6,214 |
| 77. | Naknek | 9.3% | 6.0% (+3.33)#78 | 5.8% (+3.50)#6,254 |
| 78. | College | 9.2% | 6.0% (+3.24)#79 | 5.8% (+3.41)#6,371 |
| 79. | Fishhook | 9.2% | 6.0% (+3.24)#80 | 5.8% (+3.40)#6,375 |
| 80. | Gambell | 9.0% | 6.0% (+3.04)#81 | 5.8% (+3.20)#6,612 |
| 81. | Gateway | 8.9% | 6.0% (+2.94)#82 | 5.8% (+3.10)#6,721 |
| 82. | Craig | 8.9% | 6.0% (+2.90)#83 | 5.8% (+3.06)#6,772 |
| 83. | Meadow Lakes | 8.7% | 6.0% (+2.76)#84 | 5.8% (+2.93)#6,922 |
| 84. | Badger | 8.7% | 6.0% (+2.75)#85 | 5.8% (+2.92)#6,937 |
| 85. | Fritz Creek | 8.7% | 6.0% (+2.73)#86 | 5.8% (+2.90)#6,957 |
| 86. | Seward | 8.7% | 6.0% (+2.73)#87 | 5.8% (+2.89)#6,963 |
| 87. | Knik River | 8.7% | 6.0% (+2.70)#88 | 5.8% (+2.87)#7,003 |
| 88. | Sterling | 8.5% | 6.0% (+2.54)#89 | 5.8% (+2.70)#7,218 |
| 89. | Skagway | 8.4% | 6.0% (+2.44)#90 | 5.8% (+2.61)#7,346 |
| 90. | King Cove | 8.4% | 6.0% (+2.43)#91 | 5.8% (+2.60)#7,367 |
| 91. | Klawock | 8.3% | 6.0% (+2.33)#92 | 5.8% (+2.49)#7,538 |
| 92. | South Van Horn | 8.2% | 6.0% (+2.19)#93 | 5.8% (+2.36)#7,725 |
| 93. | Hoonah | 8.0% | 6.0% (+2.06)#94 | 5.8% (+2.22)#7,930 |
| 94. | Golovin | 8.0% | 6.0% (+2.02)#95 | 5.8% (+2.18)#7,984 |
| 95. | Kenai | 8.0% | 6.0% (+2.02)#96 | 5.8% (+2.18)#7,996 |
| 96. | Juneau City And Borough | 8.0% | 6.0% (+1.97)#97 | 5.8% (+2.14)#8,048 |
| 97. | Gakona | 7.8% | 6.0% (+1.86)#98 | 5.8% (+2.03)#8,233 |
| 98. | Togiak | 7.7% | 6.0% (+1.75)#99 | 5.8% (+1.92)#8,387 |
| 99. | Chickaloon | 7.7% | 6.0% (+1.71)#100 | 5.8% (+1.88)#8,456 |
| 100. | False Pass | 7.5% | 6.0% (+1.57)#101 | 5.8% (+1.73)#8,718 |
Common Questions
What are the Top 10 Cities with the Highest Percentage of Self-Employed / Not Incorporated in Alaska?
Top 10 Cities with the Highest Percentage of Self-Employed / Not Incorporated in Alaska are:
#1
100.0%
#2
100.0%
#3
100.0%
#4
100.0%
#5
100.0%
#6
93.2%
#7
53.8%
#8
50.0%
#9
45.5%
#10
43.4%
What city has the Highest Percentage of Self-Employed / Not Incorporated in Alaska?
Fox has the Highest Percentage of Self-Employed / Not Incorporated in Alaska with 100.0%.
What is the Percentage of Self-Employed / Not Incorporated in the State of Alaska?
Percentage of Self-Employed / Not Incorporated in Alaska is 6.0%.
What is the Percentage of Self-Employed / Not Incorporated in the United States?
Percentage of Self-Employed / Not Incorporated in the United States is 5.8%.