Zip Codes with the Highest Percentage of Self-Employed / Not Incorporated in New Jersey
RELATED REPORTS & OPTIONS
Self-Employed / Not Incorporated
New Jersey
Compare Zip Codes
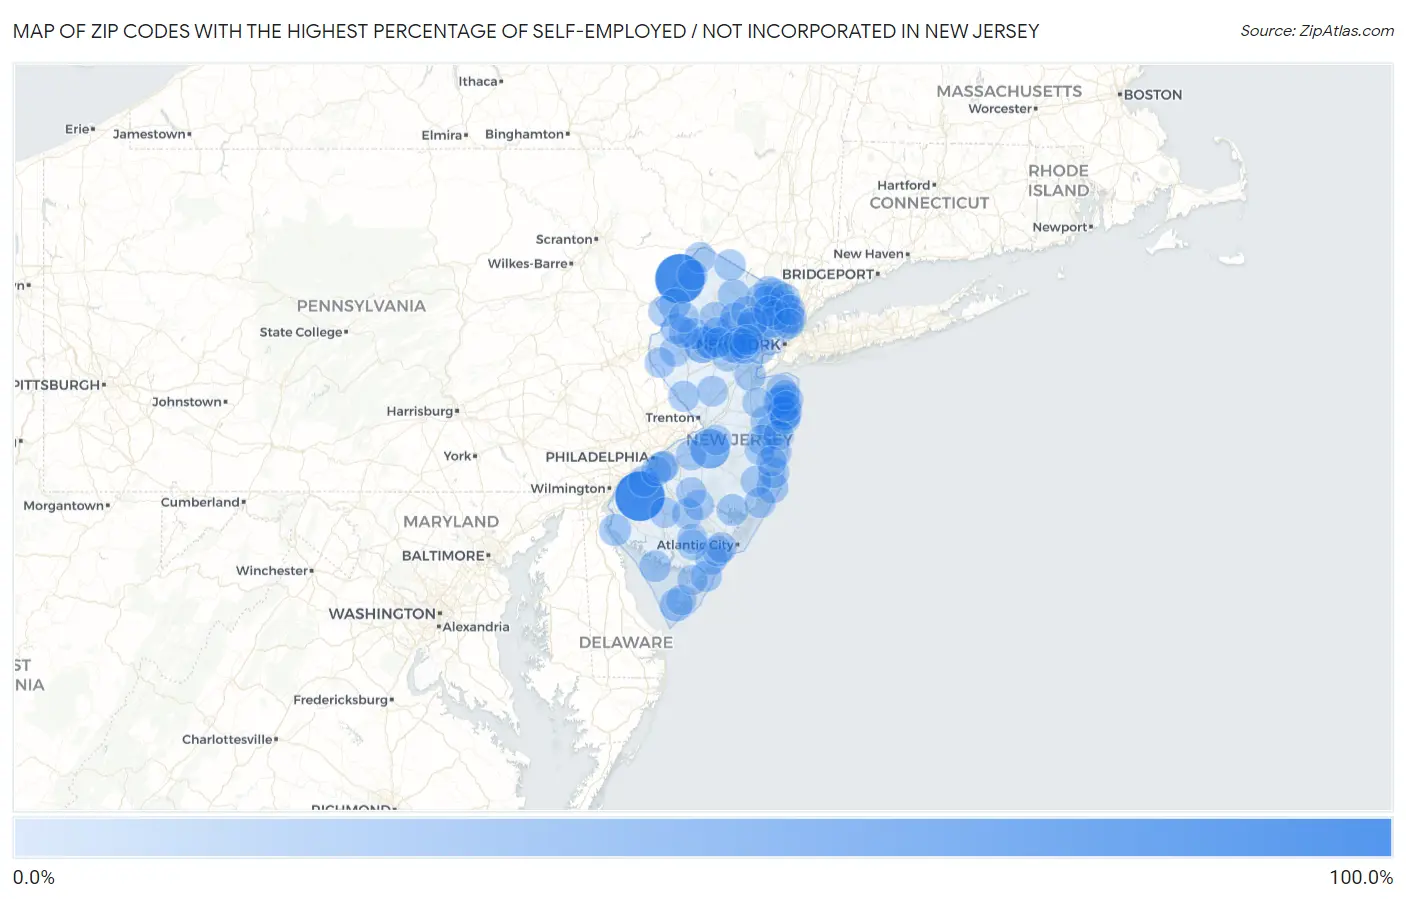
Map of Zip Codes with the Highest Percentage of Self-Employed / Not Incorporated in New Jersey
0.0%
100.0%
Zip Codes with the Highest Percentage of Self-Employed / Not Incorporated in New Jersey
| Zip Code | % Self-Employed / Not Incorporated | vs State | vs National | |
| 1. | 08039 | 100.0% | 4.7%(+95.3)#1 | 5.8%(+94.2)#38 |
| 2. | 07881 | 100.0% | 4.7%(+95.3)#2 | 5.8%(+94.2)#48 |
| 3. | 08042 | 50.0% | 4.7%(+45.3)#3 | 5.8%(+44.2)#229 |
| 4. | 07979 | 33.7% | 4.7%(+29.0)#4 | 5.8%(+27.9)#589 |
| 5. | 07723 | 23.5% | 4.7%(+18.8)#5 | 5.8%(+17.7)#1,299 |
| 6. | 07927 | 21.2% | 4.7%(+16.5)#6 | 5.8%(+15.4)#1,606 |
| 7. | 08212 | 19.6% | 4.7%(+14.9)#7 | 5.8%(+13.7)#1,906 |
| 8. | 08038 | 14.8% | 4.7%(+10.1)#8 | 5.8%(+8.98)#3,518 |
| 9. | 08720 | 14.7% | 4.7%(+10.0)#9 | 5.8%(+8.92)#3,549 |
| 10. | 07934 | 14.7% | 4.7%(+10.0)#10 | 5.8%(+8.90)#3,556 |
| 11. | 08223 | 13.9% | 4.7%(+9.24)#11 | 5.8%(+8.11)#3,937 |
| 12. | 07435 | 13.6% | 4.7%(+8.88)#12 | 5.8%(+7.75)#4,144 |
| 13. | 08321 | 12.8% | 4.7%(+8.13)#13 | 5.8%(+7.00)#4,655 |
| 14. | 08224 | 12.6% | 4.7%(+7.93)#14 | 5.8%(+6.81)#4,785 |
| 15. | 08006 | 12.6% | 4.7%(+7.92)#15 | 5.8%(+6.80)#4,794 |
| 16. | 07750 | 12.6% | 4.7%(+7.87)#16 | 5.8%(+6.74)#4,848 |
| 17. | 07727 | 12.5% | 4.7%(+7.84)#17 | 5.8%(+6.72)#4,862 |
| 18. | 07931 | 12.5% | 4.7%(+7.81)#18 | 5.8%(+6.68)#4,875 |
| 19. | 08832 | 11.8% | 4.7%(+7.12)#19 | 5.8%(+5.99)#5,443 |
| 20. | 07418 | 11.5% | 4.7%(+6.80)#20 | 5.8%(+5.67)#5,721 |
| 21. | 07458 | 11.3% | 4.7%(+6.61)#21 | 5.8%(+5.48)#5,903 |
| 22. | 07641 | 11.1% | 4.7%(+6.46)#22 | 5.8%(+5.33)#6,057 |
| 23. | 07043 | 11.1% | 4.7%(+6.37)#23 | 5.8%(+5.25)#6,139 |
| 24. | 07505 | 11.0% | 4.7%(+6.34)#24 | 5.8%(+5.22)#6,170 |
| 25. | 08056 | 10.9% | 4.7%(+6.24)#25 | 5.8%(+5.11)#6,286 |
| 26. | 08752 | 10.8% | 4.7%(+6.15)#26 | 5.8%(+5.03)#6,359 |
| 27. | 08243 | 10.8% | 4.7%(+6.14)#27 | 5.8%(+5.02)#6,371 |
| 28. | 07417 | 10.8% | 4.7%(+6.13)#28 | 5.8%(+5.01)#6,389 |
| 29. | 08758 | 10.7% | 4.7%(+6.05)#29 | 5.8%(+4.93)#6,494 |
| 30. | 07853 | 10.6% | 4.7%(+5.92)#30 | 5.8%(+4.79)#6,639 |
| 31. | 08346 | 10.6% | 4.7%(+5.88)#31 | 5.8%(+4.75)#6,692 |
| 32. | 07847 | 10.5% | 4.7%(+5.77)#32 | 5.8%(+4.64)#6,821 |
| 33. | 08059 | 10.2% | 4.7%(+5.54)#33 | 5.8%(+4.42)#7,082 |
| 34. | 08008 | 10.2% | 4.7%(+5.50)#34 | 5.8%(+4.38)#7,126 |
| 35. | 08530 | 10.1% | 4.7%(+5.43)#35 | 5.8%(+4.31)#7,203 |
| 36. | 07825 | 10.1% | 4.7%(+5.42)#36 | 5.8%(+4.29)#7,222 |
| 37. | 07935 | 10.0% | 4.7%(+5.31)#37 | 5.8%(+4.18)#7,359 |
| 38. | 07631 | 10.0% | 4.7%(+5.29)#38 | 5.8%(+4.16)#7,390 |
| 39. | 07832 | 9.8% | 4.7%(+5.07)#39 | 5.8%(+3.95)#7,679 |
| 40. | 07711 | 9.6% | 4.7%(+4.88)#40 | 5.8%(+3.75)#7,931 |
| 41. | 07677 | 9.5% | 4.7%(+4.84)#41 | 5.8%(+3.72)#7,980 |
| 42. | 08827 | 9.3% | 4.7%(+4.65)#42 | 5.8%(+3.53)#8,246 |
| 43. | 08701 | 9.3% | 4.7%(+4.65)#43 | 5.8%(+3.52)#8,254 |
| 44. | 08553 | 9.0% | 4.7%(+4.35)#44 | 5.8%(+3.23)#8,704 |
| 45. | 07863 | 8.8% | 4.7%(+4.16)#45 | 5.8%(+3.03)#9,063 |
| 46. | 08244 | 8.7% | 4.7%(+4.01)#46 | 5.8%(+2.88)#9,312 |
| 47. | 07739 | 8.7% | 4.7%(+4.00)#47 | 5.8%(+2.87)#9,330 |
| 48. | 07945 | 8.6% | 4.7%(+3.88)#48 | 5.8%(+2.76)#9,507 |
| 49. | 07827 | 8.5% | 4.7%(+3.85)#49 | 5.8%(+2.73)#9,570 |
| 50. | 08106 | 8.5% | 4.7%(+3.79)#50 | 5.8%(+2.67)#9,683 |
| 51. | 07865 | 8.5% | 4.7%(+3.78)#51 | 5.8%(+2.65)#9,720 |
| 52. | 07702 | 8.4% | 4.7%(+3.70)#52 | 5.8%(+2.58)#9,850 |
| 53. | 07068 | 8.4% | 4.7%(+3.70)#53 | 5.8%(+2.58)#9,858 |
| 54. | 08735 | 8.4% | 4.7%(+3.70)#54 | 5.8%(+2.57)#9,865 |
| 55. | 08036 | 8.3% | 4.7%(+3.65)#55 | 5.8%(+2.53)#9,960 |
| 56. | 08221 | 8.3% | 4.7%(+3.59)#56 | 5.8%(+2.47)#10,086 |
| 57. | 08848 | 8.3% | 4.7%(+3.59)#57 | 5.8%(+2.46)#10,095 |
| 58. | 07632 | 8.3% | 4.7%(+3.59)#58 | 5.8%(+2.46)#10,099 |
| 59. | 08037 | 8.2% | 4.7%(+3.54)#59 | 5.8%(+2.42)#10,169 |
| 60. | 07059 | 8.2% | 4.7%(+3.54)#60 | 5.8%(+2.41)#10,178 |
| 61. | 08089 | 8.2% | 4.7%(+3.52)#61 | 5.8%(+2.39)#10,217 |
| 62. | 07481 | 8.2% | 4.7%(+3.48)#62 | 5.8%(+2.36)#10,304 |
| 63. | 07079 | 8.1% | 4.7%(+3.45)#63 | 5.8%(+2.33)#10,366 |
| 64. | 07716 | 8.1% | 4.7%(+3.40)#64 | 5.8%(+2.27)#10,463 |
| 65. | 08562 | 8.0% | 4.7%(+3.30)#65 | 5.8%(+2.18)#10,656 |
| 66. | 07208 | 8.0% | 4.7%(+3.27)#66 | 5.8%(+2.14)#10,717 |
| 67. | 08328 | 7.9% | 4.7%(+3.25)#67 | 5.8%(+2.13)#10,751 |
| 68. | 07046 | 7.9% | 4.7%(+3.21)#68 | 5.8%(+2.09)#10,837 |
| 69. | 07755 | 7.8% | 4.7%(+3.15)#69 | 5.8%(+2.03)#10,960 |
| 70. | 07657 | 7.7% | 4.7%(+3.06)#70 | 5.8%(+1.93)#11,192 |
| 71. | 07082 | 7.7% | 4.7%(+3.04)#71 | 5.8%(+1.92)#11,218 |
| 72. | 07446 | 7.7% | 4.7%(+3.03)#72 | 5.8%(+1.91)#11,250 |
| 73. | 07756 | 7.7% | 4.7%(+3.01)#73 | 5.8%(+1.89)#11,289 |
| 74. | 08755 | 7.7% | 4.7%(+3.01)#74 | 5.8%(+1.88)#11,303 |
| 75. | 07675 | 7.7% | 4.7%(+2.96)#75 | 5.8%(+1.84)#11,413 |
| 76. | 07057 | 7.6% | 4.7%(+2.92)#76 | 5.8%(+1.80)#11,498 |
| 77. | 08204 | 7.5% | 4.7%(+2.86)#77 | 5.8%(+1.73)#11,655 |
| 78. | 08730 | 7.5% | 4.7%(+2.86)#78 | 5.8%(+1.73)#11,670 |
| 79. | 08319 | 7.5% | 4.7%(+2.83)#79 | 5.8%(+1.71)#11,723 |
| 80. | 07662 | 7.5% | 4.7%(+2.77)#80 | 5.8%(+1.64)#11,877 |
| 81. | 07006 | 7.4% | 4.7%(+2.75)#81 | 5.8%(+1.62)#11,927 |
| 82. | 07838 | 7.4% | 4.7%(+2.73)#82 | 5.8%(+1.60)#11,987 |
| 83. | 07760 | 7.3% | 4.7%(+2.66)#83 | 5.8%(+1.53)#12,178 |
| 84. | 08210 | 7.3% | 4.7%(+2.61)#84 | 5.8%(+1.49)#12,276 |
| 85. | 07514 | 7.3% | 4.7%(+2.56)#85 | 5.8%(+1.44)#12,385 |
| 86. | 08093 | 7.2% | 4.7%(+2.55)#86 | 5.8%(+1.42)#12,414 |
| 87. | 07922 | 7.2% | 4.7%(+2.55)#87 | 5.8%(+1.42)#12,418 |
| 88. | 07924 | 7.1% | 4.7%(+2.37)#88 | 5.8%(+1.24)#12,883 |
| 89. | 07740 | 7.1% | 4.7%(+2.36)#89 | 5.8%(+1.23)#12,910 |
| 90. | 07626 | 7.0% | 4.7%(+2.35)#90 | 5.8%(+1.22)#12,960 |
| 91. | 07928 | 7.0% | 4.7%(+2.31)#91 | 5.8%(+1.18)#13,064 |
| 92. | 07826 | 7.0% | 4.7%(+2.30)#92 | 5.8%(+1.18)#13,073 |
| 93. | 07933 | 7.0% | 4.7%(+2.27)#93 | 5.8%(+1.14)#13,167 |
| 94. | 07092 | 6.9% | 4.7%(+2.22)#94 | 5.8%(+1.09)#13,296 |
| 95. | 08317 | 6.9% | 4.7%(+2.21)#95 | 5.8%(+1.08)#13,325 |
| 96. | 08740 | 6.9% | 4.7%(+2.20)#96 | 5.8%(+1.07)#13,361 |
| 97. | 07901 | 6.9% | 4.7%(+2.19)#97 | 5.8%(+1.07)#13,372 |
| 98. | 07746 | 6.9% | 4.7%(+2.19)#98 | 5.8%(+1.07)#13,383 |
| 99. | 07024 | 6.9% | 4.7%(+2.18)#99 | 5.8%(+1.06)#13,402 |
| 100. | 07078 | 6.8% | 4.7%(+2.15)#100 | 5.8%(+1.03)#13,470 |
Common Questions
What are the Top 10 Zip Codes with the Highest Percentage of Self-Employed / Not Incorporated in New Jersey?
Top 10 Zip Codes with the Highest Percentage of Self-Employed / Not Incorporated in New Jersey are:
What zip code has the Highest Percentage of Self-Employed / Not Incorporated in New Jersey?
08039 has the Highest Percentage of Self-Employed / Not Incorporated in New Jersey with 100.0%.
What is the Percentage of Self-Employed / Not Incorporated in the State of New Jersey?
Percentage of Self-Employed / Not Incorporated in New Jersey is 4.7%.
What is the Percentage of Self-Employed / Not Incorporated in the United States?
Percentage of Self-Employed / Not Incorporated in the United States is 5.8%.