Cities with the Highest Percentage of Self-Employed / Not Incorporated in Massachusetts
RELATED REPORTS & OPTIONS
Self-Employed / Not Incorporated
Massachusetts
Compare Cities
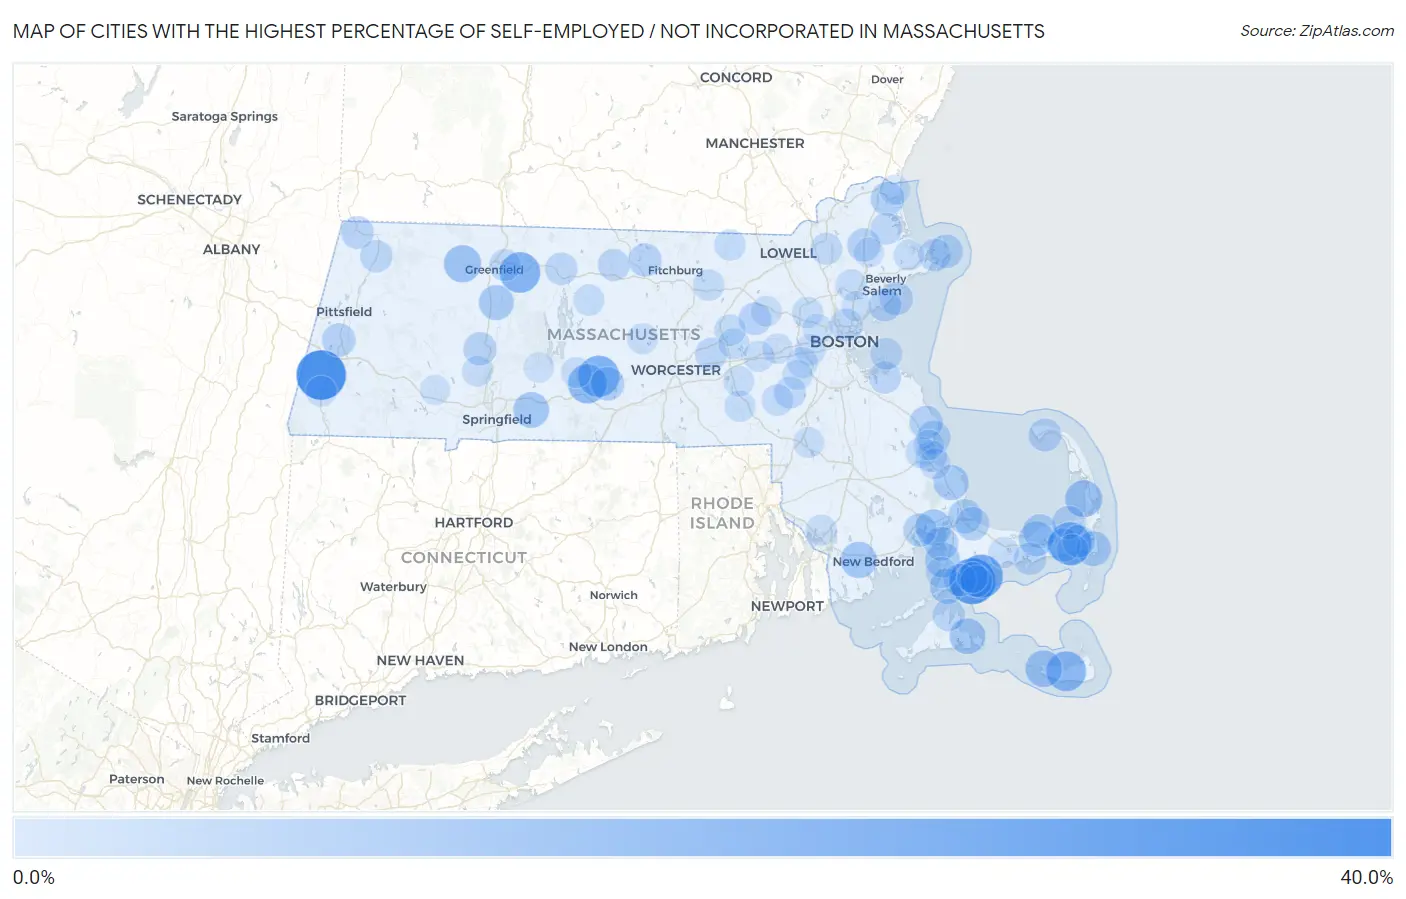
Map of Cities with the Highest Percentage of Self-Employed / Not Incorporated in Massachusetts
0.0%
40.0%
Cities with the Highest Percentage of Self-Employed / Not Incorporated in Massachusetts
| City | % Self-Employed / Not Incorporated | vs State | vs National | |
| 1. | Housatonic | 31.3% | 5.5%(+25.8)#1 | 5.8%(+25.5)#593 |
| 2. | Monomoscoy Island | 26.5% | 5.5%(+21.0)#2 | 5.8%(+20.7)#850 |
| 3. | Popponesset Island | 23.1% | 5.5%(+17.6)#3 | 5.8%(+17.3)#1,128 |
| 4. | Harwich Center | 22.3% | 5.5%(+16.8)#4 | 5.8%(+16.5)#1,205 |
| 5. | West Brookfield | 20.5% | 5.5%(+15.0)#5 | 5.8%(+14.7)#1,434 |
| 6. | Millers Falls | 19.6% | 5.5%(+14.1)#6 | 5.8%(+13.8)#1,575 |
| 7. | Nantucket | 18.4% | 5.5%(+12.9)#7 | 5.8%(+12.6)#1,779 |
| 8. | Warren | 17.6% | 5.5%(+12.2)#8 | 5.8%(+11.8)#1,928 |
| 9. | Shelburne Falls | 15.1% | 5.5%(+9.67)#9 | 5.8%(+9.33)#2,595 |
| 10. | North Eastham | 14.8% | 5.5%(+9.34)#10 | 5.8%(+9.00)#2,700 |
| 11. | Madaket | 14.5% | 5.5%(+9.04)#11 | 5.8%(+8.70)#2,800 |
| 12. | Smith Mills | 14.0% | 5.5%(+8.48)#12 | 5.8%(+8.14)#3,011 |
| 13. | Onset | 13.6% | 5.5%(+8.12)#13 | 5.8%(+7.78)#3,177 |
| 14. | Edgartown | 13.2% | 5.5%(+7.69)#14 | 5.8%(+7.35)#3,376 |
| 15. | Wilbraham | 13.2% | 5.5%(+7.69)#15 | 5.8%(+7.34)#3,378 |
| 16. | The Pinehills | 12.4% | 5.5%(+6.92)#16 | 5.8%(+6.58)#3,787 |
| 17. | Falmouth | 12.4% | 5.5%(+6.88)#17 | 5.8%(+6.54)#3,811 |
| 18. | South Deerfield | 12.3% | 5.5%(+6.83)#18 | 5.8%(+6.48)#3,838 |
| 19. | North Falmouth | 12.3% | 5.5%(+6.79)#19 | 5.8%(+6.44)#3,866 |
| 20. | Yarmouth Port | 12.2% | 5.5%(+6.74)#20 | 5.8%(+6.39)#3,889 |
| 21. | Chatham | 11.9% | 5.5%(+6.41)#21 | 5.8%(+6.07)#4,084 |
| 22. | Sagamore | 11.4% | 5.5%(+5.91)#22 | 5.8%(+5.57)#4,421 |
| 23. | Dennis | 11.3% | 5.5%(+5.78)#23 | 5.8%(+5.44)#4,500 |
| 24. | Pocasset | 11.0% | 5.5%(+5.55)#24 | 5.8%(+5.21)#4,682 |
| 25. | Green Harbor | 10.8% | 5.5%(+5.33)#25 | 5.8%(+4.99)#4,843 |
| 26. | Newburyport | 10.7% | 5.5%(+5.26)#26 | 5.8%(+4.91)#4,908 |
| 27. | Brookfield | 10.6% | 5.5%(+5.17)#27 | 5.8%(+4.83)#4,975 |
| 28. | Northwest Harwich | 10.5% | 5.5%(+5.04)#28 | 5.8%(+4.70)#5,086 |
| 29. | Sandwich | 10.5% | 5.5%(+5.02)#29 | 5.8%(+4.68)#5,099 |
| 30. | Rockport | 10.5% | 5.5%(+5.00)#30 | 5.8%(+4.65)#5,119 |
| 31. | Lenox | 10.4% | 5.5%(+4.98)#31 | 5.8%(+4.63)#5,135 |
| 32. | Duxbury | 10.4% | 5.5%(+4.95)#32 | 5.8%(+4.61)#5,169 |
| 33. | Marshfield | 10.3% | 5.5%(+4.86)#33 | 5.8%(+4.52)#5,239 |
| 34. | Weweantic | 10.3% | 5.5%(+4.79)#34 | 5.8%(+4.45)#5,294 |
| 35. | Brewster | 10.2% | 5.5%(+4.71)#35 | 5.8%(+4.37)#5,371 |
| 36. | Marblehead | 10.2% | 5.5%(+4.71)#36 | 5.8%(+4.36)#5,377 |
| 37. | Northampton | 10.1% | 5.5%(+4.68)#37 | 5.8%(+4.33)#5,396 |
| 38. | Greenfield | 10.1% | 5.5%(+4.62)#38 | 5.8%(+4.27)#5,445 |
| 39. | Boxford | 10.0% | 5.5%(+4.57)#39 | 5.8%(+4.23)#5,482 |
| 40. | South Ashburnham | 9.9% | 5.5%(+4.48)#40 | 5.8%(+4.13)#5,604 |
| 41. | Provincetown | 9.8% | 5.5%(+4.34)#41 | 5.8%(+4.00)#5,733 |
| 42. | Swampscott | 9.6% | 5.5%(+4.17)#42 | 5.8%(+3.83)#5,936 |
| 43. | Williamstown | 9.5% | 5.5%(+4.08)#43 | 5.8%(+3.73)#6,035 |
| 44. | Maynard | 9.4% | 5.5%(+3.96)#44 | 5.8%(+3.62)#6,155 |
| 45. | West Yarmouth | 9.4% | 5.5%(+3.89)#45 | 5.8%(+3.54)#6,215 |
| 46. | Gloucester | 9.3% | 5.5%(+3.84)#46 | 5.8%(+3.50)#6,256 |
| 47. | East Falmouth | 9.3% | 5.5%(+3.80)#47 | 5.8%(+3.45)#6,313 |
| 48. | Everett | 9.3% | 5.5%(+3.79)#48 | 5.8%(+3.45)#6,315 |
| 49. | East Harwich | 9.2% | 5.5%(+3.76)#49 | 5.8%(+3.41)#6,364 |
| 50. | Orange | 9.0% | 5.5%(+3.57)#50 | 5.8%(+3.23)#6,578 |
| 51. | Vineyard Haven | 9.0% | 5.5%(+3.55)#51 | 5.8%(+3.20)#6,611 |
| 52. | Adams | 9.0% | 5.5%(+3.50)#52 | 5.8%(+3.15)#6,659 |
| 53. | Northborough | 8.7% | 5.5%(+3.28)#53 | 5.8%(+2.93)#6,915 |
| 54. | Hingham | 8.7% | 5.5%(+3.26)#54 | 5.8%(+2.92)#6,933 |
| 55. | Baldwinville | 8.6% | 5.5%(+3.16)#55 | 5.8%(+2.81)#7,069 |
| 56. | Andover | 8.5% | 5.5%(+3.00)#56 | 5.8%(+2.66)#7,280 |
| 57. | Turners Falls | 8.4% | 5.5%(+2.94)#57 | 5.8%(+2.60)#7,366 |
| 58. | Hull | 8.4% | 5.5%(+2.90)#58 | 5.8%(+2.56)#7,421 |
| 59. | Rowley | 8.3% | 5.5%(+2.88)#59 | 5.8%(+2.53)#7,455 |
| 60. | Medfield | 8.3% | 5.5%(+2.84)#60 | 5.8%(+2.50)#7,535 |
| 61. | North Plymouth | 8.2% | 5.5%(+2.70)#61 | 5.8%(+2.36)#7,727 |
| 62. | New Seabury | 8.1% | 5.5%(+2.63)#62 | 5.8%(+2.28)#7,841 |
| 63. | Millis Clicquot | 8.1% | 5.5%(+2.61)#63 | 5.8%(+2.27)#7,865 |
| 64. | Hudson | 8.0% | 5.5%(+2.48)#64 | 5.8%(+2.14)#8,049 |
| 65. | Harwich Port | 7.8% | 5.5%(+2.38)#65 | 5.8%(+2.03)#8,222 |
| 66. | Shirley | 7.8% | 5.5%(+2.36)#66 | 5.8%(+2.02)#8,238 |
| 67. | East Pepperell | 7.7% | 5.5%(+2.21)#67 | 5.8%(+1.87)#8,491 |
| 68. | Kingston | 7.7% | 5.5%(+2.20)#68 | 5.8%(+1.86)#8,498 |
| 69. | Lexington | 7.6% | 5.5%(+2.17)#69 | 5.8%(+1.83)#8,548 |
| 70. | West Falmouth | 7.6% | 5.5%(+2.16)#70 | 5.8%(+1.82)#8,561 |
| 71. | Lynnfield | 7.6% | 5.5%(+2.14)#71 | 5.8%(+1.79)#8,608 |
| 72. | Petersham | 7.6% | 5.5%(+2.11)#72 | 5.8%(+1.77)#8,644 |
| 73. | Newton | 7.6% | 5.5%(+2.08)#73 | 5.8%(+1.74)#8,708 |
| 74. | Needham | 7.5% | 5.5%(+2.02)#74 | 5.8%(+1.67)#8,840 |
| 75. | Milford | 7.4% | 5.5%(+1.90)#75 | 5.8%(+1.56)#9,044 |
| 76. | Marlborough | 7.3% | 5.5%(+1.86)#76 | 5.8%(+1.52)#9,113 |
| 77. | Barnstable Town | 7.3% | 5.5%(+1.80)#77 | 5.8%(+1.45)#9,225 |
| 78. | Great Barrington | 7.3% | 5.5%(+1.79)#78 | 5.8%(+1.45)#9,232 |
| 79. | Somerset | 7.3% | 5.5%(+1.79)#79 | 5.8%(+1.45)#9,235 |
| 80. | Essex | 7.3% | 5.5%(+1.78)#80 | 5.8%(+1.44)#9,247 |
| 81. | Framingham | 7.2% | 5.5%(+1.74)#81 | 5.8%(+1.40)#9,325 |
| 82. | Rutland | 7.2% | 5.5%(+1.70)#82 | 5.8%(+1.35)#9,395 |
| 83. | Plymouth | 7.1% | 5.5%(+1.66)#83 | 5.8%(+1.31)#9,497 |
| 84. | Easthampton Town | 7.1% | 5.5%(+1.65)#84 | 5.8%(+1.30)#9,510 |
| 85. | Mansfield Center | 7.1% | 5.5%(+1.63)#85 | 5.8%(+1.29)#9,527 |
| 86. | Seabrook | 7.1% | 5.5%(+1.61)#86 | 5.8%(+1.27)#9,575 |
| 87. | Ware | 7.1% | 5.5%(+1.61)#87 | 5.8%(+1.26)#9,580 |
| 88. | Cedar Crest | 7.1% | 5.5%(+1.59)#88 | 5.8%(+1.25)#9,609 |
| 89. | Hopkinton | 7.1% | 5.5%(+1.59)#89 | 5.8%(+1.24)#9,616 |
| 90. | Oak Bluffs | 7.0% | 5.5%(+1.56)#90 | 5.8%(+1.22)#9,671 |
| 91. | West Concord | 6.9% | 5.5%(+1.43)#91 | 5.8%(+1.09)#9,920 |
| 92. | South Duxbury | 6.7% | 5.5%(+1.22)#92 | 5.8%(+0.881)#10,380 |
| 93. | Salisbury | 6.6% | 5.5%(+1.16)#93 | 5.8%(+0.815)#10,530 |
| 94. | Cochituate | 6.6% | 5.5%(+1.12)#94 | 5.8%(+0.775)#10,616 |
| 95. | Dover | 6.5% | 5.5%(+0.989)#95 | 5.8%(+0.645)#10,917 |
| 96. | Belmont | 6.4% | 5.5%(+0.929)#96 | 5.8%(+0.586)#11,052 |
| 97. | Belchertown | 6.4% | 5.5%(+0.888)#97 | 5.8%(+0.545)#11,139 |
| 98. | Russell | 6.4% | 5.5%(+0.888)#98 | 5.8%(+0.545)#11,140 |
| 99. | Saugus | 6.3% | 5.5%(+0.828)#99 | 5.8%(+0.485)#11,277 |
| 100. | Topsfield | 6.2% | 5.5%(+0.773)#100 | 5.8%(+0.429)#11,434 |
Common Questions
What are the Top 10 Cities with the Highest Percentage of Self-Employed / Not Incorporated in Massachusetts?
Top 10 Cities with the Highest Percentage of Self-Employed / Not Incorporated in Massachusetts are:
#1
31.3%
#2
26.5%
#3
23.1%
#4
22.3%
#5
20.5%
#6
19.6%
#7
18.4%
#8
17.6%
#9
15.1%
#10
14.8%
What city has the Highest Percentage of Self-Employed / Not Incorporated in Massachusetts?
Housatonic has the Highest Percentage of Self-Employed / Not Incorporated in Massachusetts with 31.3%.
What is the Percentage of Self-Employed / Not Incorporated in the State of Massachusetts?
Percentage of Self-Employed / Not Incorporated in Massachusetts is 5.5%.
What is the Percentage of Self-Employed / Not Incorporated in the United States?
Percentage of Self-Employed / Not Incorporated in the United States is 5.8%.