Cities with the Highest Percentage of Self-Employed / Not Incorporated in Florida
RELATED REPORTS & OPTIONS
Self-Employed / Not Incorporated
Florida
Compare Cities
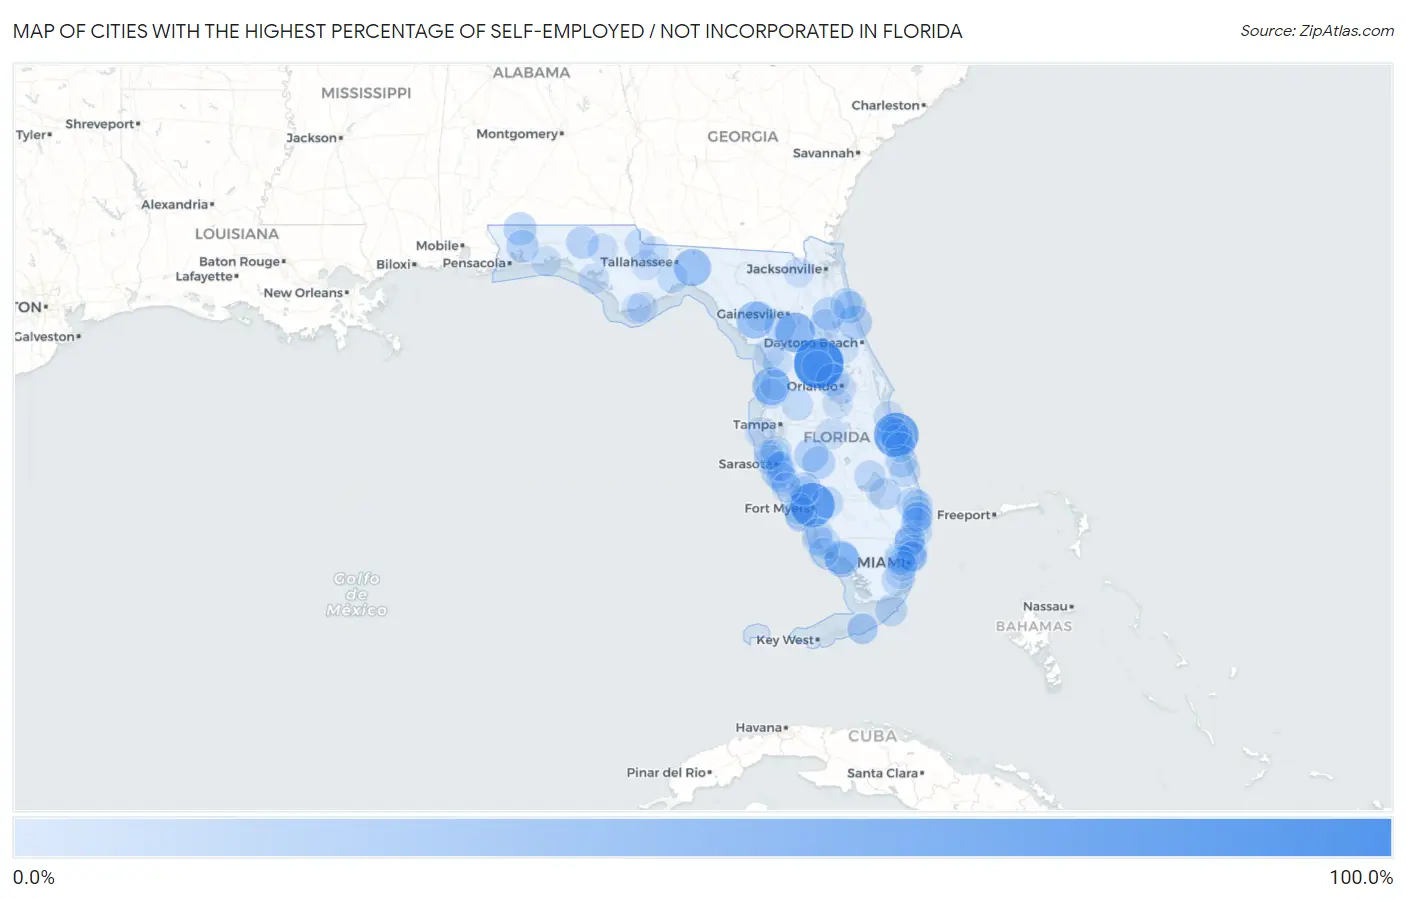
Map of Cities with the Highest Percentage of Self-Employed / Not Incorporated in Florida
0.0%
100.0%
Cities with the Highest Percentage of Self-Employed / Not Incorporated in Florida
| City | % Self-Employed / Not Incorporated | vs State | vs National | |
| 1. | Lisbon | 82.2% | 6.1%(+76.1)#1 | 5.8%(+76.4)#83 |
| 2. | Windsor | 63.6% | 6.1%(+57.5)#2 | 5.8%(+57.8)#129 |
| 3. | Palmona Park | 61.9% | 6.1%(+55.8)#3 | 5.8%(+56.1)#139 |
| 4. | Reddick | 46.0% | 6.1%(+39.9)#4 | 5.8%(+40.2)#282 |
| 5. | Weeki Wachee Gardens | 38.9% | 6.1%(+32.8)#5 | 5.8%(+33.1)#400 |
| 6. | Wacissa | 36.8% | 6.1%(+30.7)#6 | 5.8%(+31.0)#442 |
| 7. | Andrews | 36.5% | 6.1%(+30.4)#7 | 5.8%(+30.7)#447 |
| 8. | Chokoloskee | 27.7% | 6.1%(+21.6)#8 | 5.8%(+21.9)#765 |
| 9. | Beverly Beach | 25.0% | 6.1%(+18.9)#9 | 5.8%(+19.2)#941 |
| 10. | Everglades | 25.0% | 6.1%(+18.9)#10 | 5.8%(+19.2)#946 |
| 11. | Vamo | 24.2% | 6.1%(+18.1)#11 | 5.8%(+18.4)#1,016 |
| 12. | Ona | 23.7% | 6.1%(+17.6)#12 | 5.8%(+17.9)#1,057 |
| 13. | East Palatka | 22.2% | 6.1%(+16.2)#13 | 5.8%(+16.4)#1,209 |
| 14. | Fidelis | 21.9% | 6.1%(+15.8)#14 | 5.8%(+16.1)#1,254 |
| 15. | St James City | 21.6% | 6.1%(+15.5)#15 | 5.8%(+15.8)#1,276 |
| 16. | Gardner | 21.6% | 6.1%(+15.5)#16 | 5.8%(+15.8)#1,279 |
| 17. | Orchid | 21.2% | 6.1%(+15.2)#17 | 5.8%(+15.4)#1,334 |
| 18. | Solana | 20.8% | 6.1%(+14.8)#18 | 5.8%(+15.0)#1,390 |
| 19. | Roeville | 20.5% | 6.1%(+14.4)#19 | 5.8%(+14.7)#1,425 |
| 20. | Paradise Heights | 20.5% | 6.1%(+14.4)#20 | 5.8%(+14.7)#1,428 |
| 21. | Ponce De Leon | 20.4% | 6.1%(+14.3)#21 | 5.8%(+14.5)#1,458 |
| 22. | Stacey Street | 19.8% | 6.1%(+13.7)#22 | 5.8%(+14.0)#1,552 |
| 23. | Crescent Beach | 19.1% | 6.1%(+13.0)#23 | 5.8%(+13.3)#1,652 |
| 24. | Indian River Shores | 18.6% | 6.1%(+12.5)#24 | 5.8%(+12.8)#1,739 |
| 25. | Tavernier | 18.6% | 6.1%(+12.5)#25 | 5.8%(+12.8)#1,746 |
| 26. | Canal Point | 18.2% | 6.1%(+12.1)#26 | 5.8%(+12.4)#1,808 |
| 27. | White City | 18.1% | 6.1%(+12.1)#27 | 5.8%(+12.3)#1,835 |
| 28. | Welaka | 18.1% | 6.1%(+12.0)#28 | 5.8%(+12.3)#1,837 |
| 29. | Desoto Acres | 18.0% | 6.1%(+11.9)#29 | 5.8%(+12.2)#1,856 |
| 30. | Hillsboro Beach | 17.8% | 6.1%(+11.7)#30 | 5.8%(+12.0)#1,896 |
| 31. | Alva | 17.2% | 6.1%(+11.1)#31 | 5.8%(+11.4)#2,034 |
| 32. | Raleigh | 17.2% | 6.1%(+11.1)#32 | 5.8%(+11.3)#2,044 |
| 33. | Homestead Base | 17.1% | 6.1%(+11.0)#33 | 5.8%(+11.3)#2,061 |
| 34. | Buckhead Ridge | 16.8% | 6.1%(+10.7)#34 | 5.8%(+10.9)#2,116 |
| 35. | Roseland | 16.6% | 6.1%(+10.6)#35 | 5.8%(+10.8)#2,177 |
| 36. | St Augustine Shores | 16.6% | 6.1%(+10.5)#36 | 5.8%(+10.7)#2,191 |
| 37. | Biscayne Park | 16.4% | 6.1%(+10.3)#37 | 5.8%(+10.6)#2,222 |
| 38. | Old Miakka | 16.3% | 6.1%(+10.2)#38 | 5.8%(+10.5)#2,262 |
| 39. | North River Shores | 16.0% | 6.1%(+9.90)#39 | 5.8%(+10.2)#2,340 |
| 40. | Zephyrhills North | 15.9% | 6.1%(+9.78)#40 | 5.8%(+10.1)#2,376 |
| 41. | Verona Walk | 15.6% | 6.1%(+9.49)#41 | 5.8%(+9.76)#2,452 |
| 42. | Silver Lake | 15.4% | 6.1%(+9.35)#42 | 5.8%(+9.62)#2,492 |
| 43. | Medley | 15.4% | 6.1%(+9.34)#43 | 5.8%(+9.62)#2,498 |
| 44. | Ellenton | 15.3% | 6.1%(+9.20)#44 | 5.8%(+9.47)#2,549 |
| 45. | Pine Island Center | 15.0% | 6.1%(+8.88)#45 | 5.8%(+9.15)#2,648 |
| 46. | Crawfordville | 14.4% | 6.1%(+8.31)#46 | 5.8%(+8.58)#2,832 |
| 47. | Key Colony Beach | 14.3% | 6.1%(+8.20)#47 | 5.8%(+8.47)#2,867 |
| 48. | Palm Beach | 14.0% | 6.1%(+7.94)#48 | 5.8%(+8.22)#2,980 |
| 49. | Franklin Park | 14.0% | 6.1%(+7.94)#49 | 5.8%(+8.21)#2,982 |
| 50. | Pelican Bay | 14.0% | 6.1%(+7.91)#50 | 5.8%(+8.18)#2,992 |
| 51. | Washington Park | 13.9% | 6.1%(+7.78)#51 | 5.8%(+8.06)#3,054 |
| 52. | Hillcrest Heights | 13.8% | 6.1%(+7.66)#52 | 5.8%(+7.93)#3,110 |
| 53. | Inglis | 13.7% | 6.1%(+7.64)#53 | 5.8%(+7.92)#3,118 |
| 54. | Sneads | 13.5% | 6.1%(+7.43)#54 | 5.8%(+7.71)#3,211 |
| 55. | South Palm Beach | 13.4% | 6.1%(+7.30)#55 | 5.8%(+7.57)#3,267 |
| 56. | Eastpoint | 13.3% | 6.1%(+7.24)#56 | 5.8%(+7.51)#3,308 |
| 57. | Islamorada | 13.2% | 6.1%(+7.13)#57 | 5.8%(+7.41)#3,347 |
| 58. | Rainbow Park | 13.2% | 6.1%(+7.09)#58 | 5.8%(+7.37)#3,369 |
| 59. | Upper Grand Lagoon | 13.2% | 6.1%(+7.07)#59 | 5.8%(+7.34)#3,377 |
| 60. | Heritage Pines | 13.1% | 6.1%(+7.05)#60 | 5.8%(+7.32)#3,391 |
| 61. | Naples | 13.1% | 6.1%(+7.03)#61 | 5.8%(+7.31)#3,396 |
| 62. | West Samoset | 12.9% | 6.1%(+6.85)#62 | 5.8%(+7.12)#3,481 |
| 63. | North Weeki Wachee | 12.9% | 6.1%(+6.83)#63 | 5.8%(+7.10)#3,493 |
| 64. | Melbourne Beach | 12.9% | 6.1%(+6.79)#64 | 5.8%(+7.07)#3,512 |
| 65. | Plantation | 12.8% | 6.1%(+6.71)#65 | 5.8%(+6.98)#3,553 |
| 66. | North Redington Beach | 12.8% | 6.1%(+6.69)#66 | 5.8%(+6.96)#3,564 |
| 67. | Longboat Key | 12.7% | 6.1%(+6.62)#67 | 5.8%(+6.89)#3,591 |
| 68. | South Gate Ridge | 12.6% | 6.1%(+6.53)#68 | 5.8%(+6.81)#3,639 |
| 69. | Briny Breezes | 12.6% | 6.1%(+6.52)#69 | 5.8%(+6.79)#3,647 |
| 70. | Wausau | 12.6% | 6.1%(+6.50)#70 | 5.8%(+6.77)#3,654 |
| 71. | Holden Heights | 12.6% | 6.1%(+6.50)#71 | 5.8%(+6.77)#3,655 |
| 72. | Hosford | 12.5% | 6.1%(+6.45)#72 | 5.8%(+6.73)#3,673 |
| 73. | North Bay Village | 12.5% | 6.1%(+6.43)#73 | 5.8%(+6.70)#3,688 |
| 74. | Gretna | 12.3% | 6.1%(+6.24)#74 | 5.8%(+6.51)#3,822 |
| 75. | Nokomis | 12.3% | 6.1%(+6.20)#75 | 5.8%(+6.47)#3,842 |
| 76. | Macclenny | 12.3% | 6.1%(+6.20)#76 | 5.8%(+6.47)#3,844 |
| 77. | Cortez | 12.3% | 6.1%(+6.19)#77 | 5.8%(+6.46)#3,855 |
| 78. | Broadview Park | 12.2% | 6.1%(+6.10)#78 | 5.8%(+6.38)#3,908 |
| 79. | Hallandale Beach | 12.0% | 6.1%(+5.95)#79 | 5.8%(+6.22)#3,995 |
| 80. | Shalimar | 12.0% | 6.1%(+5.92)#80 | 5.8%(+6.19)#4,015 |
| 81. | West Perrine | 12.0% | 6.1%(+5.88)#81 | 5.8%(+6.16)#4,033 |
| 82. | Black Diamond | 12.0% | 6.1%(+5.87)#82 | 5.8%(+6.15)#4,038 |
| 83. | Trenton | 11.9% | 6.1%(+5.86)#83 | 5.8%(+6.13)#4,051 |
| 84. | Virginia Gardens | 11.9% | 6.1%(+5.84)#84 | 5.8%(+6.11)#4,065 |
| 85. | De Leon Springs | 11.9% | 6.1%(+5.82)#85 | 5.8%(+6.10)#4,070 |
| 86. | Gulf Stream | 11.9% | 6.1%(+5.81)#86 | 5.8%(+6.08)#4,081 |
| 87. | Highland Beach | 11.9% | 6.1%(+5.78)#87 | 5.8%(+6.05)#4,096 |
| 88. | Surfside | 11.8% | 6.1%(+5.74)#88 | 5.8%(+6.01)#4,118 |
| 89. | Marathon | 11.8% | 6.1%(+5.73)#89 | 5.8%(+6.01)#4,120 |
| 90. | Marco Shores-Hammock Bay | 11.8% | 6.1%(+5.71)#90 | 5.8%(+5.99)#4,138 |
| 91. | Campbell | 11.8% | 6.1%(+5.69)#91 | 5.8%(+5.96)#4,151 |
| 92. | South Beach | 11.8% | 6.1%(+5.68)#92 | 5.8%(+5.95)#4,156 |
| 93. | Doral | 11.7% | 6.1%(+5.64)#93 | 5.8%(+5.91)#4,190 |
| 94. | Marco Island | 11.7% | 6.1%(+5.63)#94 | 5.8%(+5.90)#4,196 |
| 95. | Apalachicola | 11.5% | 6.1%(+5.46)#95 | 5.8%(+5.73)#4,291 |
| 96. | Glenvar Heights | 11.5% | 6.1%(+5.42)#96 | 5.8%(+5.70)#4,331 |
| 97. | Charlotte Park | 11.5% | 6.1%(+5.40)#97 | 5.8%(+5.68)#4,349 |
| 98. | Verandah | 11.5% | 6.1%(+5.36)#98 | 5.8%(+5.64)#4,369 |
| 99. | Lake Sarasota | 11.4% | 6.1%(+5.35)#99 | 5.8%(+5.62)#4,380 |
| 100. | Englewood | 11.4% | 6.1%(+5.32)#100 | 5.8%(+5.59)#4,399 |
Common Questions
What are the Top 10 Cities with the Highest Percentage of Self-Employed / Not Incorporated in Florida?
Top 10 Cities with the Highest Percentage of Self-Employed / Not Incorporated in Florida are:
#1
82.2%
#2
63.6%
#3
61.9%
#4
46.0%
#5
38.9%
#6
36.8%
#7
36.5%
#8
27.7%
#9
25.0%
#10
25.0%
What city has the Highest Percentage of Self-Employed / Not Incorporated in Florida?
Lisbon has the Highest Percentage of Self-Employed / Not Incorporated in Florida with 82.2%.
What is the Percentage of Self-Employed / Not Incorporated in the State of Florida?
Percentage of Self-Employed / Not Incorporated in Florida is 6.1%.
What is the Percentage of Self-Employed / Not Incorporated in the United States?
Percentage of Self-Employed / Not Incorporated in the United States is 5.8%.