Cities with the Highest Percentage of Self-Employed / Not Incorporated in Delaware
RELATED REPORTS & OPTIONS
Self-Employed / Not Incorporated
Delaware
Compare Cities
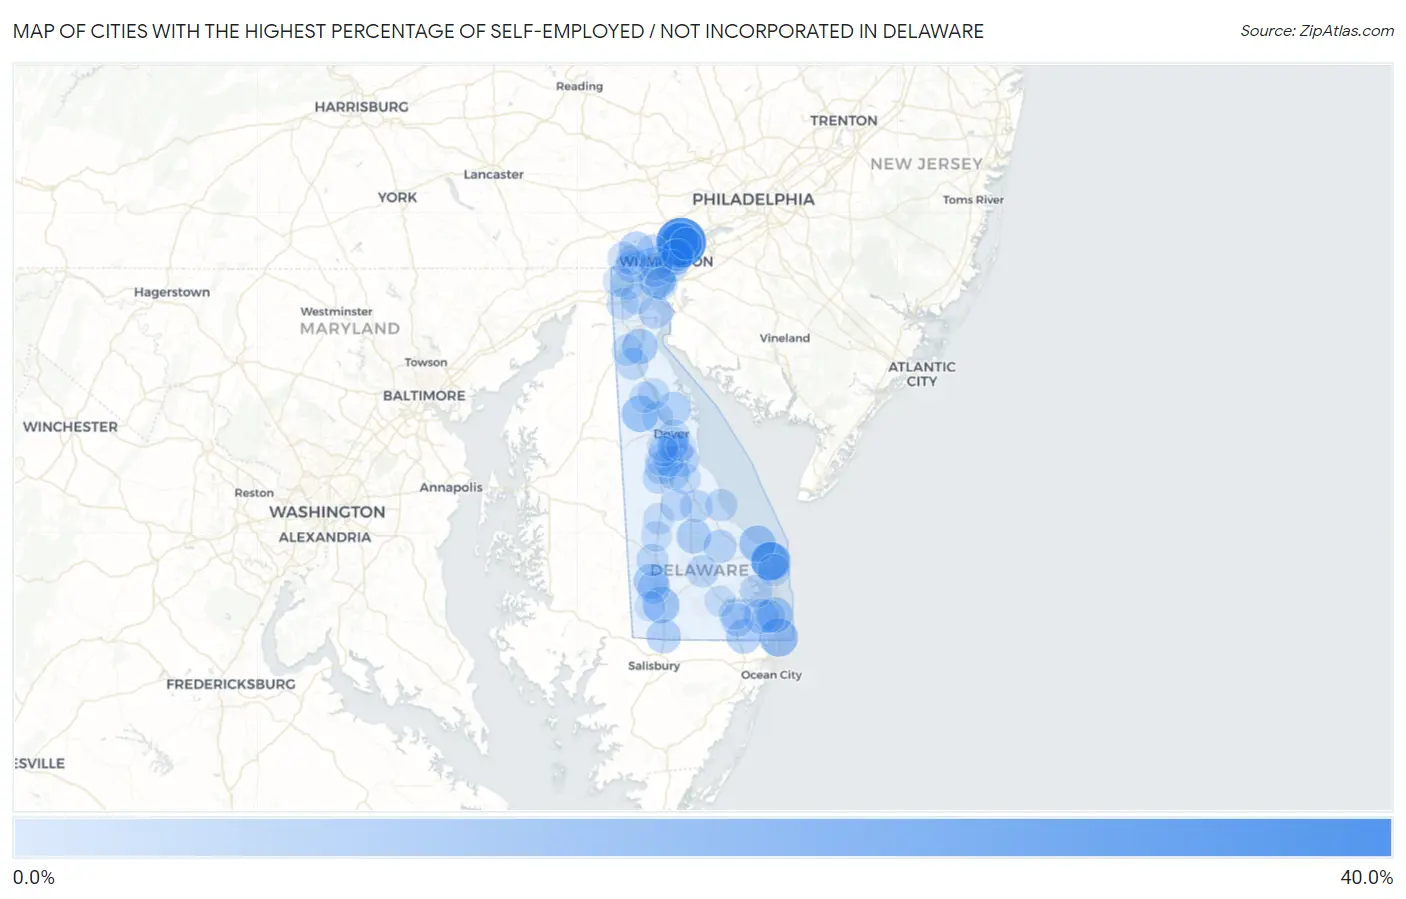
Map of Cities with the Highest Percentage of Self-Employed / Not Incorporated in Delaware
0.0%
40.0%
Cities with the Highest Percentage of Self-Employed / Not Incorporated in Delaware
| City | % Self-Employed / Not Incorporated | vs State | vs National | |
| 1. | Ardentown | 35.0% | 4.4%(+30.6)#1 | 5.8%(+29.2)#486 |
| 2. | Ardencroft | 23.9% | 4.4%(+19.5)#2 | 5.8%(+18.1)#1,049 |
| 3. | Henlopen Acres | 15.6% | 4.4%(+11.2)#3 | 5.8%(+9.81)#2,438 |
| 4. | Fenwick Island | 14.3% | 4.4%(+9.85)#4 | 5.8%(+8.47)#2,871 |
| 5. | Rehoboth Beach | 13.8% | 4.4%(+9.35)#5 | 5.8%(+7.97)#3,092 |
| 6. | Arden | 11.6% | 4.4%(+7.21)#6 | 5.8%(+5.83)#4,239 |
| 7. | Laurel | 11.4% | 4.4%(+6.94)#7 | 5.8%(+5.56)#4,426 |
| 8. | Wilmington Manor | 11.3% | 4.4%(+6.90)#8 | 5.8%(+5.53)#4,445 |
| 9. | Lewes | 11.3% | 4.4%(+6.86)#9 | 5.8%(+5.48)#4,477 |
| 10. | Kenton | 11.3% | 4.4%(+6.81)#10 | 5.8%(+5.43)#4,506 |
| 11. | Bethany Beach | 9.8% | 4.4%(+5.36)#11 | 5.8%(+3.98)#5,750 |
| 12. | Edgemoor | 9.2% | 4.4%(+4.81)#12 | 5.8%(+3.43)#6,334 |
| 13. | Odessa | 9.1% | 4.4%(+4.71)#13 | 5.8%(+3.33)#6,445 |
| 14. | Seaford | 8.9% | 4.4%(+4.49)#14 | 5.8%(+3.11)#6,702 |
| 15. | Millville | 8.2% | 4.4%(+3.80)#15 | 5.8%(+2.43)#7,631 |
| 16. | Selbyville | 8.1% | 4.4%(+3.62)#16 | 5.8%(+2.25)#7,891 |
| 17. | Ellendale | 8.0% | 4.4%(+3.58)#17 | 5.8%(+2.21)#7,955 |
| 18. | Hockessin | 7.7% | 4.4%(+3.24)#18 | 5.8%(+1.86)#8,493 |
| 19. | Delmar | 7.5% | 4.4%(+3.08)#19 | 5.8%(+1.70)#8,787 |
| 20. | Leipsic | 6.7% | 4.4%(+2.30)#20 | 5.8%(+0.926)#10,287 |
| 21. | Newport | 6.3% | 4.4%(+1.82)#21 | 5.8%(+0.446)#11,359 |
| 22. | Rising Sun Lebanon | 5.8% | 4.4%(+1.34)#22 | 5.8%(-0.038)#12,602 |
| 23. | Magnolia | 5.7% | 4.4%(+1.24)#23 | 5.8%(-0.134)#12,832 |
| 24. | Ocean View | 5.5% | 4.4%(+1.08)#24 | 5.8%(-0.298)#13,319 |
| 25. | Milton | 5.5% | 4.4%(+1.07)#25 | 5.8%(-0.306)#13,346 |
| 26. | Pike Creek Valley | 5.5% | 4.4%(+1.03)#26 | 5.8%(-0.343)#13,450 |
| 27. | Frankford | 5.4% | 4.4%(+0.973)#27 | 5.8%(-0.404)#13,630 |
| 28. | Elsmere | 5.1% | 4.4%(+0.689)#28 | 5.8%(-0.688)#14,461 |
| 29. | Long Neck | 5.0% | 4.4%(+0.592)#29 | 5.8%(-0.785)#14,735 |
| 30. | Viola | 4.9% | 4.4%(+0.439)#30 | 5.8%(-0.938)#15,224 |
| 31. | Blades | 4.8% | 4.4%(+0.386)#31 | 5.8%(-0.991)#15,379 |
| 32. | Delaware City | 4.7% | 4.4%(+0.226)#32 | 5.8%(-1.15)#15,857 |
| 33. | Wilmington | 4.6% | 4.4%(+0.140)#33 | 5.8%(-1.24)#16,156 |
| 34. | Greenville | 4.5% | 4.4%(+0.077)#34 | 5.8%(-1.30)#16,369 |
| 35. | Milford | 4.5% | 4.4%(+0.055)#35 | 5.8%(-1.32)#16,445 |
| 36. | New Castle | 4.4% | 4.4%(-0.085)#36 | 5.8%(-1.46)#16,886 |
| 37. | Bellefonte | 4.2% | 4.4%(-0.231)#37 | 5.8%(-1.61)#17,369 |
| 38. | Felton | 4.1% | 4.4%(-0.339)#38 | 5.8%(-1.72)#17,698 |
| 39. | Georgetown | 4.1% | 4.4%(-0.354)#39 | 5.8%(-1.73)#17,750 |
| 40. | Slaughter Beach | 4.0% | 4.4%(-0.392)#40 | 5.8%(-1.77)#17,888 |
| 41. | Dewey Beach | 4.0% | 4.4%(-0.392)#41 | 5.8%(-1.77)#17,891 |
| 42. | Riverview | 3.8% | 4.4%(-0.678)#42 | 5.8%(-2.05)#18,785 |
| 43. | Bridgeville | 3.7% | 4.4%(-0.740)#43 | 5.8%(-2.12)#19,019 |
| 44. | Townsend | 3.6% | 4.4%(-0.825)#44 | 5.8%(-2.20)#19,283 |
| 45. | Houston | 3.6% | 4.4%(-0.839)#45 | 5.8%(-2.22)#19,330 |
| 46. | Claymont | 3.5% | 4.4%(-0.922)#46 | 5.8%(-2.30)#19,593 |
| 47. | Dagsboro | 3.5% | 4.4%(-0.973)#47 | 5.8%(-2.35)#19,748 |
| 48. | North Star | 3.3% | 4.4%(-1.10)#48 | 5.8%(-2.47)#20,158 |
| 49. | Glasgow | 3.3% | 4.4%(-1.11)#49 | 5.8%(-2.49)#20,200 |
| 50. | Cheswold | 3.2% | 4.4%(-1.25)#50 | 5.8%(-2.62)#20,596 |
| 51. | Brookside | 3.1% | 4.4%(-1.32)#51 | 5.8%(-2.70)#20,817 |
| 52. | Middletown | 2.9% | 4.4%(-1.59)#52 | 5.8%(-2.96)#21,615 |
| 53. | Woodside | 2.8% | 4.4%(-1.61)#53 | 5.8%(-2.99)#21,666 |
| 54. | Newark | 2.7% | 4.4%(-1.76)#54 | 5.8%(-3.14)#22,088 |
| 55. | Bear | 2.5% | 4.4%(-1.93)#55 | 5.8%(-3.30)#22,469 |
| 56. | Frederica | 2.5% | 4.4%(-1.97)#56 | 5.8%(-3.35)#22,580 |
| 57. | Dover | 2.3% | 4.4%(-2.10)#57 | 5.8%(-3.48)#22,898 |
| 58. | Farmington | 2.3% | 4.4%(-2.17)#58 | 5.8%(-3.54)#23,064 |
| 59. | Smyrna | 2.2% | 4.4%(-2.23)#59 | 5.8%(-3.60)#23,203 |
| 60. | Clayton | 2.1% | 4.4%(-2.35)#60 | 5.8%(-3.72)#23,481 |
| 61. | Millsboro | 2.1% | 4.4%(-2.36)#61 | 5.8%(-3.73)#23,506 |
| 62. | Kent Acres | 2.0% | 4.4%(-2.40)#62 | 5.8%(-3.77)#23,594 |
| 63. | Greenwood | 2.0% | 4.4%(-2.48)#63 | 5.8%(-3.85)#23,762 |
| 64. | Woodside East | 1.8% | 4.4%(-2.65)#64 | 5.8%(-4.02)#24,093 |
| 65. | Highland Acres | 1.7% | 4.4%(-2.77)#65 | 5.8%(-4.15)#24,344 |
| 66. | Wyoming | 1.6% | 4.4%(-2.86)#66 | 5.8%(-4.23)#24,511 |
| 67. | Pike Creek | 1.1% | 4.4%(-3.30)#67 | 5.8%(-4.68)#25,192 |
| 68. | Bethel | 0.83% | 4.4%(-3.61)#68 | 5.8%(-4.99)#25,582 |
| 69. | Camden | 0.78% | 4.4%(-3.66)#69 | 5.8%(-5.04)#25,657 |
| 70. | Dover Base Housing | 0.32% | 4.4%(-4.12)#70 | 5.8%(-5.50)#25,984 |
1
Common Questions
What are the Top 10 Cities with the Highest Percentage of Self-Employed / Not Incorporated in Delaware?
Top 10 Cities with the Highest Percentage of Self-Employed / Not Incorporated in Delaware are:
#1
35.0%
#2
23.9%
#3
15.6%
#4
14.3%
#5
13.8%
#6
11.6%
#7
11.4%
#8
11.3%
#9
11.3%
#10
11.3%
What city has the Highest Percentage of Self-Employed / Not Incorporated in Delaware?
Ardentown has the Highest Percentage of Self-Employed / Not Incorporated in Delaware with 35.0%.
What is the Percentage of Self-Employed / Not Incorporated in the State of Delaware?
Percentage of Self-Employed / Not Incorporated in Delaware is 4.4%.
What is the Percentage of Self-Employed / Not Incorporated in the United States?
Percentage of Self-Employed / Not Incorporated in the United States is 5.8%.