Cities with the Highest Percentage of Self-Employed / Not Incorporated in Indiana
RELATED REPORTS & OPTIONS
Self-Employed / Not Incorporated
Indiana
Compare Cities
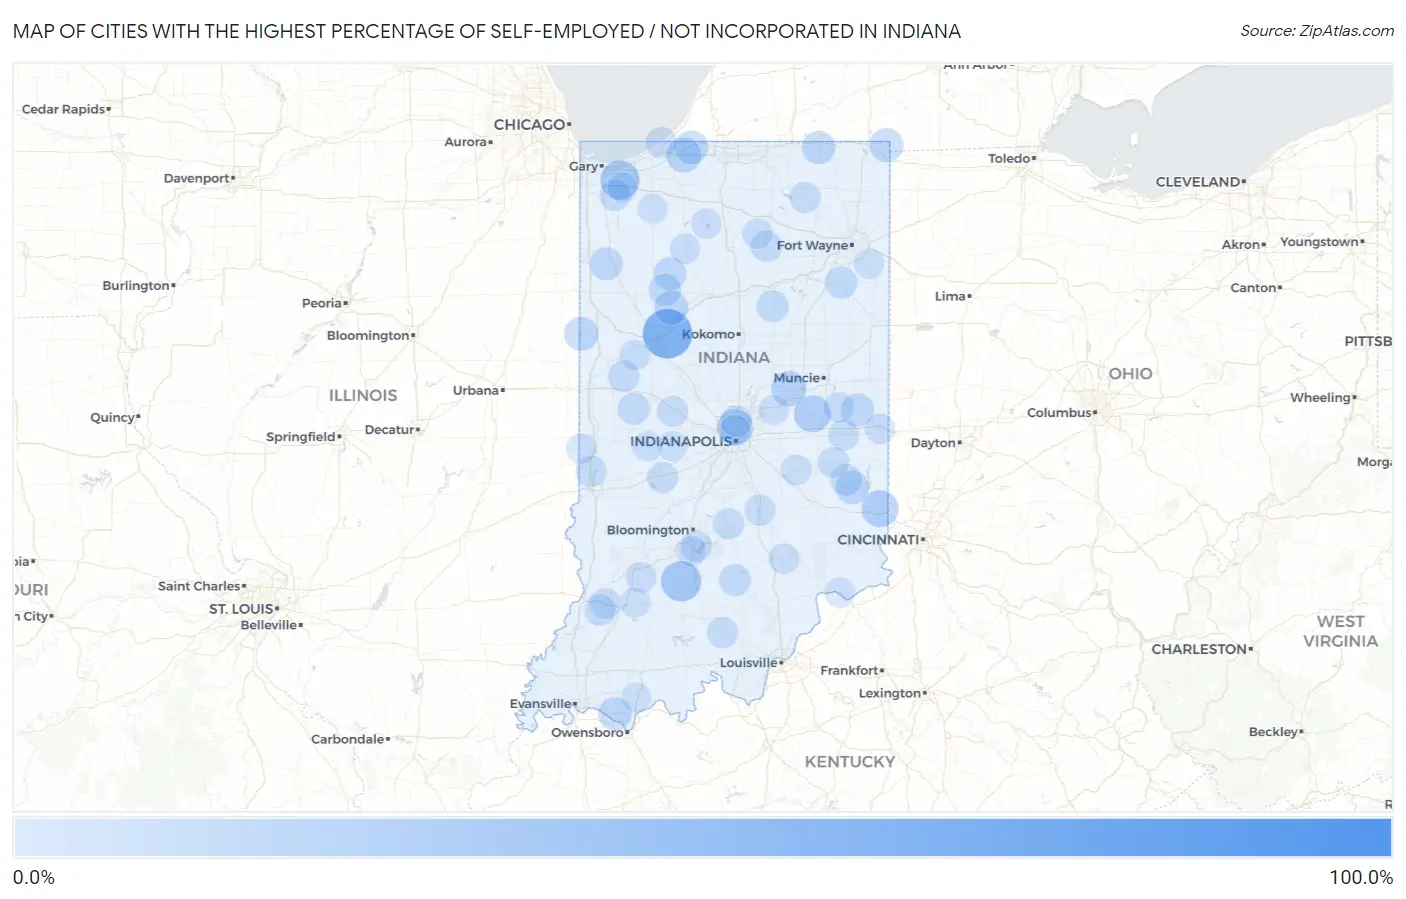
Map of Cities with the Highest Percentage of Self-Employed / Not Incorporated in Indiana
0.0%
100.0%
Cities with the Highest Percentage of Self-Employed / Not Incorporated in Indiana
| City | % Self-Employed / Not Incorporated | vs State | vs National | |
| 1. | Independence | 100.0% | 4.5%(+95.5)#1 | 5.8%(+94.2)#40 |
| 2. | Buck Creek | 61.4% | 4.5%(+56.9)#2 | 5.8%(+55.6)#145 |
| 3. | Commiskey | 58.9% | 4.5%(+54.4)#3 | 5.8%(+53.1)#157 |
| 4. | West Middleton | 58.3% | 4.5%(+53.8)#4 | 5.8%(+52.4)#164 |
| 5. | Hashtown | 55.0% | 4.5%(+50.5)#5 | 5.8%(+49.2)#186 |
| 6. | Saugany Lake | 54.2% | 4.5%(+49.7)#6 | 5.8%(+48.4)#195 |
| 7. | Hedrick | 50.8% | 4.5%(+46.4)#7 | 5.8%(+45.0)#222 |
| 8. | Kramer | 38.5% | 4.5%(+34.0)#8 | 5.8%(+32.6)#412 |
| 9. | Williams | 36.8% | 4.5%(+32.3)#9 | 5.8%(+30.9)#443 |
| 10. | Wheeler | 33.3% | 4.5%(+28.8)#10 | 5.8%(+27.5)#524 |
| 11. | Azalia | 31.4% | 4.5%(+26.9)#11 | 5.8%(+25.6)#590 |
| 12. | Blairsville | 31.4% | 4.5%(+26.9)#12 | 5.8%(+25.6)#591 |
| 13. | Fountaintown | 29.3% | 4.5%(+24.8)#13 | 5.8%(+23.5)#682 |
| 14. | New Trenton | 27.3% | 4.5%(+22.8)#14 | 5.8%(+21.5)#793 |
| 15. | Cadiz | 27.3% | 4.5%(+22.8)#15 | 5.8%(+21.5)#794 |
| 16. | Laotto | 26.9% | 4.5%(+22.4)#16 | 5.8%(+21.1)#815 |
| 17. | Carrollton | 26.5% | 4.5%(+22.0)#17 | 5.8%(+20.6)#851 |
| 18. | Crows Nest | 25.9% | 4.5%(+21.4)#18 | 5.8%(+20.1)#881 |
| 19. | Marshfield | 25.7% | 4.5%(+21.2)#19 | 5.8%(+19.9)#900 |
| 20. | Cassville | 24.8% | 4.5%(+20.3)#20 | 5.8%(+18.9)#972 |
| 21. | Pierceville | 22.9% | 4.5%(+18.4)#21 | 5.8%(+17.1)#1,140 |
| 22. | Woodlawn Heights | 22.9% | 4.5%(+18.4)#22 | 5.8%(+17.1)#1,141 |
| 23. | Rolling Prairie | 21.8% | 4.5%(+17.3)#23 | 5.8%(+16.0)#1,259 |
| 24. | Grantsburg | 21.4% | 4.5%(+16.9)#24 | 5.8%(+15.6)#1,307 |
| 25. | Abington | 20.3% | 4.5%(+15.8)#25 | 5.8%(+14.5)#1,462 |
| 26. | Metz | 20.0% | 4.5%(+15.5)#26 | 5.8%(+14.2)#1,521 |
| 27. | Patricksburg | 19.8% | 4.5%(+15.3)#27 | 5.8%(+13.9)#1,558 |
| 28. | Ambia | 19.7% | 4.5%(+15.2)#28 | 5.8%(+13.9)#1,559 |
| 29. | Yeoman | 19.6% | 4.5%(+15.1)#29 | 5.8%(+13.8)#1,568 |
| 30. | Duneland Beach | 19.4% | 4.5%(+14.9)#30 | 5.8%(+13.6)#1,597 |
| 31. | Prairieton | 19.4% | 4.5%(+14.9)#31 | 5.8%(+13.6)#1,601 |
| 32. | Clear Lake | 18.9% | 4.5%(+14.4)#32 | 5.8%(+13.1)#1,693 |
| 33. | Hudson Lake | 18.8% | 4.5%(+14.3)#33 | 5.8%(+12.9)#1,711 |
| 34. | Haysville | 18.3% | 4.5%(+13.8)#34 | 5.8%(+12.5)#1,795 |
| 35. | Metamora | 18.3% | 4.5%(+13.8)#35 | 5.8%(+12.5)#1,799 |
| 36. | Howe | 18.2% | 4.5%(+13.7)#36 | 5.8%(+12.4)#1,812 |
| 37. | Antioch | 18.1% | 4.5%(+13.6)#37 | 5.8%(+12.2)#1,843 |
| 38. | Hatfield | 18.0% | 4.5%(+13.5)#38 | 5.8%(+12.2)#1,859 |
| 39. | Celestine | 17.8% | 4.5%(+13.3)#39 | 5.8%(+12.0)#1,891 |
| 40. | Economy | 17.7% | 4.5%(+13.2)#40 | 5.8%(+11.9)#1,916 |
| 41. | Buffalo | 17.4% | 4.5%(+12.9)#41 | 5.8%(+11.6)#1,977 |
| 42. | Mount Ayr | 17.1% | 4.5%(+12.6)#42 | 5.8%(+11.3)#2,054 |
| 43. | Norway | 16.0% | 4.5%(+11.5)#43 | 5.8%(+10.2)#2,329 |
| 44. | Uniondale | 16.0% | 4.5%(+11.5)#44 | 5.8%(+10.2)#2,330 |
| 45. | Fairview | 16.0% | 4.5%(+11.5)#45 | 5.8%(+10.2)#2,335 |
| 46. | Medora | 15.1% | 4.5%(+10.6)#46 | 5.8%(+9.25)#2,617 |
| 47. | Alamo | 15.0% | 4.5%(+10.5)#47 | 5.8%(+9.18)#2,640 |
| 48. | Somerset | 15.0% | 4.5%(+10.5)#48 | 5.8%(+9.14)#2,655 |
| 49. | New London | 14.6% | 4.5%(+10.1)#49 | 5.8%(+8.77)#2,781 |
| 50. | Williams Creek | 13.6% | 4.5%(+9.07)#50 | 5.8%(+7.75)#3,194 |
| 51. | Reddington | 13.5% | 4.5%(+9.03)#51 | 5.8%(+7.71)#3,210 |
| 52. | Charlottesville | 13.5% | 4.5%(+9.02)#52 | 5.8%(+7.70)#3,217 |
| 53. | Newtown | 13.5% | 4.5%(+9.02)#53 | 5.8%(+7.70)#3,219 |
| 54. | Laurel | 13.5% | 4.5%(+8.97)#54 | 5.8%(+7.65)#3,242 |
| 55. | Silver Lake | 13.0% | 4.5%(+8.50)#55 | 5.8%(+7.18)#3,455 |
| 56. | Poland | 13.0% | 4.5%(+8.49)#56 | 5.8%(+7.17)#3,460 |
| 57. | Lakes Of The Four Seasons | 12.9% | 4.5%(+8.37)#57 | 5.8%(+7.05)#3,519 |
| 58. | Smithville Sanders | 12.8% | 4.5%(+8.32)#58 | 5.8%(+7.00)#3,543 |
| 59. | Hardinsburg | 12.8% | 4.5%(+8.27)#59 | 5.8%(+6.95)#3,571 |
| 60. | Cloverdale | 12.7% | 4.5%(+8.24)#60 | 5.8%(+6.92)#3,578 |
| 61. | Michiana Shores | 12.7% | 4.5%(+8.21)#61 | 5.8%(+6.89)#3,592 |
| 62. | Kimmell | 12.5% | 4.5%(+8.00)#62 | 5.8%(+6.68)#3,700 |
| 63. | Browns Crossing | 12.4% | 4.5%(+7.93)#63 | 5.8%(+6.61)#3,769 |
| 64. | Nashville | 12.4% | 4.5%(+7.92)#64 | 5.8%(+6.60)#3,780 |
| 65. | Dublin | 12.3% | 4.5%(+7.77)#65 | 5.8%(+6.45)#3,862 |
| 66. | Taylorsville | 12.3% | 4.5%(+7.77)#66 | 5.8%(+6.45)#3,863 |
| 67. | New Ross | 12.3% | 4.5%(+7.77)#67 | 5.8%(+6.45)#3,864 |
| 68. | Fishersburg | 12.2% | 4.5%(+7.75)#68 | 5.8%(+6.43)#3,875 |
| 69. | Monroe City | 12.2% | 4.5%(+7.71)#69 | 5.8%(+6.39)#3,891 |
| 70. | Glenwood | 12.2% | 4.5%(+7.67)#70 | 5.8%(+6.35)#3,920 |
| 71. | Wheatland | 12.1% | 4.5%(+7.64)#71 | 5.8%(+6.32)#3,932 |
| 72. | Tecumseh | 11.8% | 4.5%(+7.34)#72 | 5.8%(+6.02)#4,108 |
| 73. | Bretzville | 11.4% | 4.5%(+6.87)#73 | 5.8%(+5.55)#4,433 |
| 74. | Oswego | 11.3% | 4.5%(+6.84)#74 | 5.8%(+5.52)#4,449 |
| 75. | Maples | 11.3% | 4.5%(+6.75)#75 | 5.8%(+5.43)#4,509 |
| 76. | Manilla | 11.2% | 4.5%(+6.72)#76 | 5.8%(+5.40)#4,526 |
| 77. | Burket | 11.0% | 4.5%(+6.53)#77 | 5.8%(+5.21)#4,676 |
| 78. | Odon | 10.9% | 4.5%(+6.41)#78 | 5.8%(+5.09)#4,761 |
| 79. | Mooreland | 10.9% | 4.5%(+6.37)#79 | 5.8%(+5.05)#4,786 |
| 80. | Thayer | 10.8% | 4.5%(+6.30)#80 | 5.8%(+4.98)#4,847 |
| 81. | Winamac | 10.8% | 4.5%(+6.29)#81 | 5.8%(+4.97)#4,857 |
| 82. | Hayden | 10.6% | 4.5%(+6.07)#82 | 5.8%(+4.75)#5,030 |
| 83. | St Bernice | 10.5% | 4.5%(+6.03)#83 | 5.8%(+4.71)#5,063 |
| 84. | Culver | 10.5% | 4.5%(+5.96)#84 | 5.8%(+4.64)#5,125 |
| 85. | West Point | 10.4% | 4.5%(+5.92)#85 | 5.8%(+4.60)#5,171 |
| 86. | Schnellville | 10.4% | 4.5%(+5.87)#86 | 5.8%(+4.55)#5,207 |
| 87. | Harrodsburg | 10.4% | 4.5%(+5.87)#87 | 5.8%(+4.55)#5,213 |
| 88. | Spring Grove | 10.3% | 4.5%(+5.85)#88 | 5.8%(+4.53)#5,222 |
| 89. | Hoagland | 10.3% | 4.5%(+5.82)#89 | 5.8%(+4.50)#5,260 |
| 90. | Brooksburg | 10.3% | 4.5%(+5.76)#90 | 5.8%(+4.44)#5,317 |
| 91. | Heritage Lake | 10.1% | 4.5%(+5.64)#91 | 5.8%(+4.32)#5,403 |
| 92. | Van Bibber Lake | 10.1% | 4.5%(+5.63)#92 | 5.8%(+4.31)#5,415 |
| 93. | Montgomery | 10.0% | 4.5%(+5.54)#93 | 5.8%(+4.22)#5,485 |
| 94. | Chrisney | 10.0% | 4.5%(+5.50)#94 | 5.8%(+4.18)#5,514 |
| 95. | Rocky Ripple | 10.0% | 4.5%(+5.47)#95 | 5.8%(+4.15)#5,581 |
| 96. | Stanford | 10.0% | 4.5%(+5.46)#96 | 5.8%(+4.14)#5,597 |
| 97. | Shorewood Forest | 9.7% | 4.5%(+5.20)#97 | 5.8%(+3.88)#5,884 |
| 98. | Ingalls | 9.6% | 4.5%(+5.15)#98 | 5.8%(+3.83)#5,934 |
| 99. | La Crosse | 9.6% | 4.5%(+5.13)#99 | 5.8%(+3.81)#5,950 |
| 100. | Newbern | 9.6% | 4.5%(+5.08)#100 | 5.8%(+3.76)#6,008 |
Common Questions
What are the Top 10 Cities with the Highest Percentage of Self-Employed / Not Incorporated in Indiana?
Top 10 Cities with the Highest Percentage of Self-Employed / Not Incorporated in Indiana are:
#1
61.4%
#2
36.8%
#3
33.3%
#4
27.3%
#5
27.3%
#6
25.9%
#7
22.9%
#8
21.8%
#9
19.7%
#10
19.6%
What city has the Highest Percentage of Self-Employed / Not Incorporated in Indiana?
Buck Creek has the Highest Percentage of Self-Employed / Not Incorporated in Indiana with 61.4%.
What is the Percentage of Self-Employed / Not Incorporated in the State of Indiana?
Percentage of Self-Employed / Not Incorporated in Indiana is 4.5%.
What is the Percentage of Self-Employed / Not Incorporated in the United States?
Percentage of Self-Employed / Not Incorporated in the United States is 5.8%.