Zip Codes with the Highest Percentage of Not-for-profit Organizations in Millstone Township, NJ
RELATED REPORTS & OPTIONS
Not-for-profit Organizations
Millstone Township
Compare Zip Codes
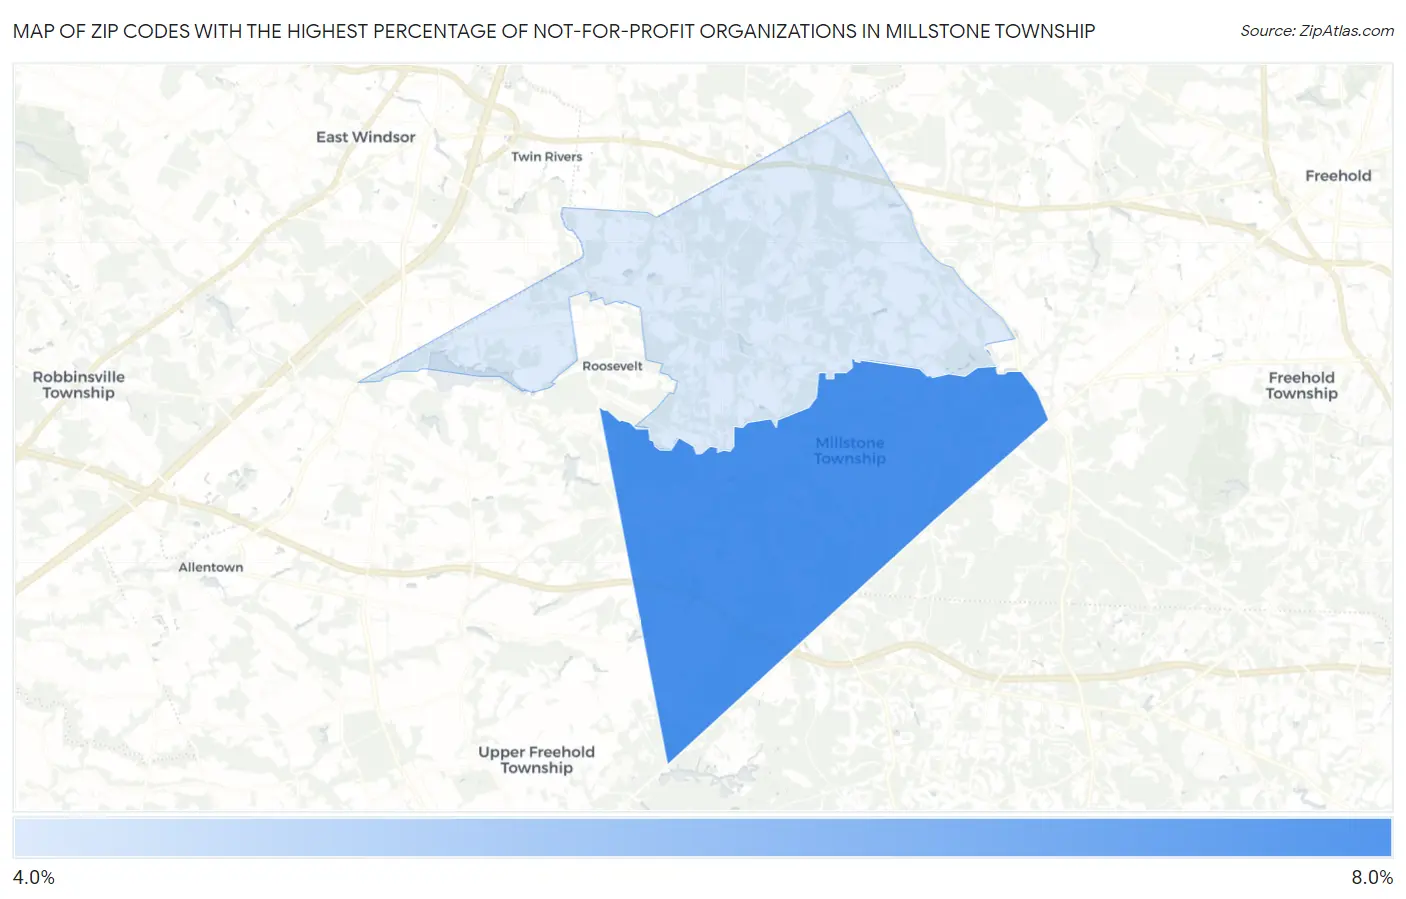
Map of Zip Codes with the Highest Percentage of Not-for-profit Organizations in Millstone Township
4.2%
7.3%
Zip Codes with the Highest Percentage of Not-for-profit Organizations in Millstone Township, NJ
| Zip Code | % Employed in Not-for-profit | vs State | vs National | |
| 1. | 08510 | 7.3% | 7.4%(-0.090)#257 | 8.4%(-1.12)#15,617 |
| 2. | 08535 | 4.2% | 7.4%(-3.22)#515 | 8.4%(-4.25)#24,271 |
1
Common Questions
What are the Top Zip Codes with the Highest Percentage of Not-for-profit Organizations in Millstone Township, NJ?
Top Zip Codes with the Highest Percentage of Not-for-profit Organizations in Millstone Township, NJ are:
What zip code has the Highest Percentage of Not-for-profit Organizations in Millstone Township, NJ?
08510 has the Highest Percentage of Not-for-profit Organizations in Millstone Township, NJ with 7.3%.
What is the Percentage of Not-for-profit Organizations in New Jersey?
Percentage of Not-for-profit Organizations in New Jersey is 7.4%.
What is the Percentage of Not-for-profit Organizations in the United States?
Percentage of Not-for-profit Organizations in the United States is 8.4%.