Cities with the Highest Percentage of Population Enrolled in High School in Connecticut
RELATED REPORTS & OPTIONS
High School
Connecticut
Compare Cities
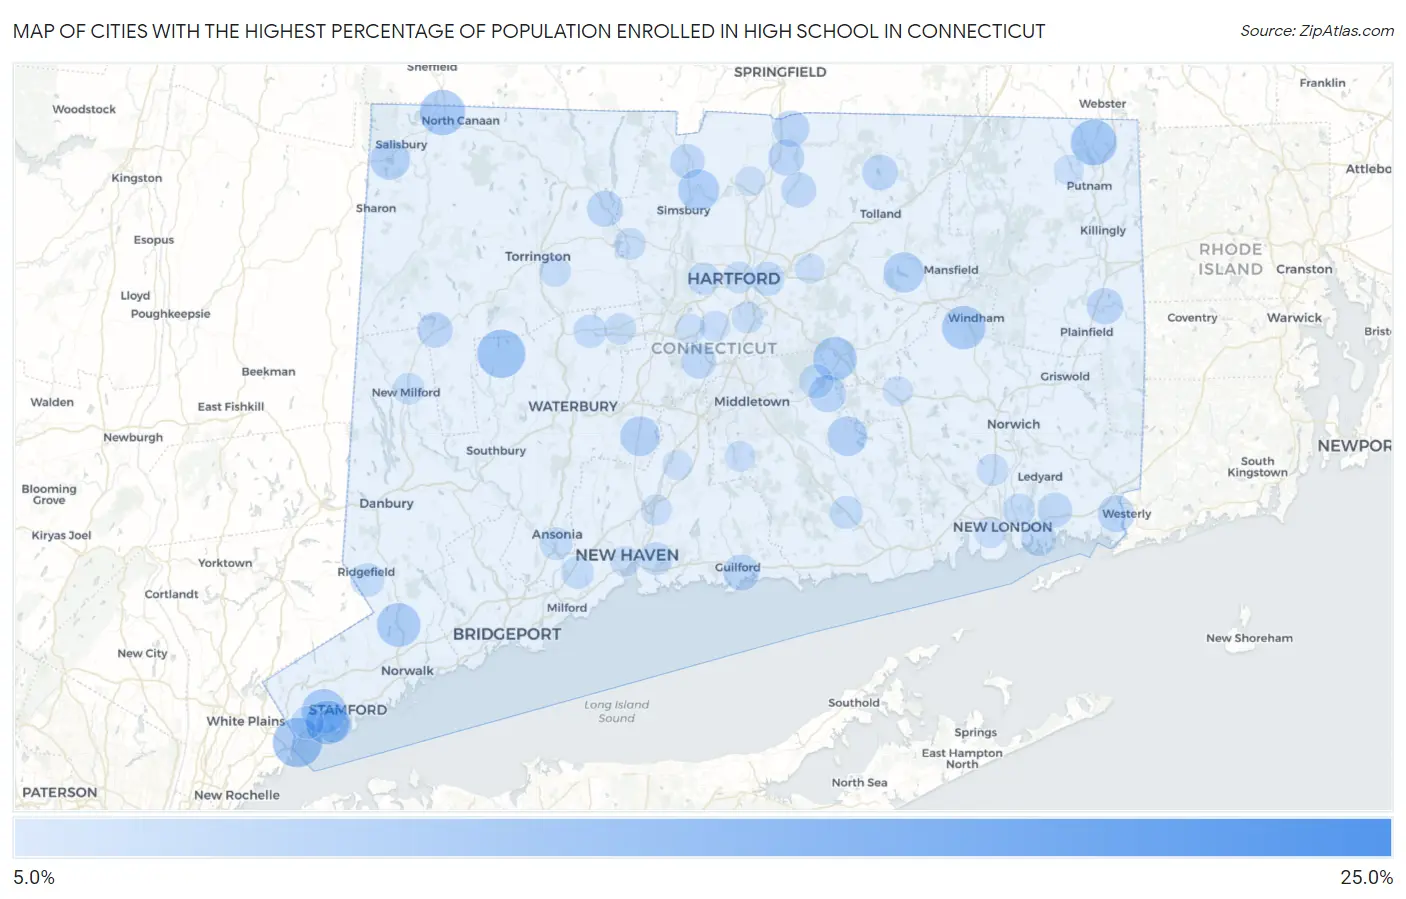
Map of Cities with the Highest Percentage of Population Enrolled in High School in Connecticut
0.0%
25.0%
Cities with the Highest Percentage of Population Enrolled in High School in Connecticut
| City | % in High School | vs State | vs National | |
| 1. | Sail Harbor | 21.7% | 5.5%(+16.1)#1 | 5.4%(+16.3)#265 |
| 2. | Candlewood Knolls | 20.6% | 5.5%(+15.1)#2 | 5.4%(+15.2)#314 |
| 3. | Redding Center | 18.9% | 5.5%(+13.3)#3 | 5.4%(+13.5)#404 |
| 4. | Lake Chaffee | 15.5% | 5.5%(+9.96)#4 | 5.4%(+10.1)#728 |
| 5. | Taylor Corners | 15.2% | 5.5%(+9.72)#5 | 5.4%(+9.86)#762 |
| 6. | Hawleyville | 14.7% | 5.5%(+9.20)#6 | 5.4%(+9.34)#843 |
| 7. | Bogus Hill | 13.6% | 5.5%(+8.04)#7 | 5.4%(+8.18)#1,067 |
| 8. | Candlewood Shores | 12.2% | 5.5%(+6.65)#8 | 5.4%(+6.79)#1,442 |
| 9. | Botsford | 11.7% | 5.5%(+6.17)#9 | 5.4%(+6.31)#1,661 |
| 10. | Quasset Lake | 11.6% | 5.5%(+6.08)#10 | 5.4%(+6.22)#1,719 |
| 11. | Byram | 11.0% | 5.5%(+5.47)#11 | 5.4%(+5.62)#2,003 |
| 12. | Cornwall | 10.8% | 5.5%(+5.31)#12 | 5.4%(+5.46)#2,087 |
| 13. | Mill Plain | 10.8% | 5.5%(+5.26)#13 | 5.4%(+5.40)#2,122 |
| 14. | Bethlehem Village | 10.7% | 5.5%(+5.15)#14 | 5.4%(+5.30)#2,184 |
| 15. | Compo | 10.7% | 5.5%(+5.13)#15 | 5.4%(+5.27)#2,199 |
| 16. | Trumbull Center | 10.4% | 5.5%(+4.87)#16 | 5.4%(+5.02)#2,384 |
| 17. | Plattsville | 10.2% | 5.5%(+4.63)#17 | 5.4%(+4.77)#2,536 |
| 18. | North Grosvenor Dale | 10.0% | 5.5%(+4.48)#18 | 5.4%(+4.62)#2,656 |
| 19. | Tashua | 9.9% | 5.5%(+4.38)#19 | 5.4%(+4.52)#2,746 |
| 20. | Canaan | 9.9% | 5.5%(+4.33)#20 | 5.4%(+4.47)#2,789 |
| 21. | Cornwall Bridge | 9.8% | 5.5%(+4.25)#21 | 5.4%(+4.39)#2,857 |
| 22. | Pleasant Valley | 9.8% | 5.5%(+4.24)#22 | 5.4%(+4.38)#2,862 |
| 23. | Cos Cob | 9.5% | 5.5%(+4.01)#23 | 5.4%(+4.16)#3,061 |
| 24. | Noroton | 9.5% | 5.5%(+3.96)#24 | 5.4%(+4.10)#3,129 |
| 25. | Riverside | 9.4% | 5.5%(+3.89)#25 | 5.4%(+4.03)#3,192 |
| 26. | Greens Farms | 9.4% | 5.5%(+3.88)#26 | 5.4%(+4.03)#3,197 |
| 27. | Wilton Center | 9.3% | 5.5%(+3.82)#27 | 5.4%(+3.96)#3,266 |
| 28. | Terramuggus | 9.3% | 5.5%(+3.79)#28 | 5.4%(+3.94)#3,297 |
| 29. | South Windham | 9.3% | 5.5%(+3.76)#29 | 5.4%(+3.90)#3,327 |
| 30. | New Canaan | 9.2% | 5.5%(+3.72)#30 | 5.4%(+3.86)#3,370 |
| 31. | Old Hill | 8.9% | 5.5%(+3.34)#31 | 5.4%(+3.49)#3,793 |
| 32. | Tariffville | 8.6% | 5.5%(+3.03)#32 | 5.4%(+3.18)#4,196 |
| 33. | South Coventry | 8.4% | 5.5%(+2.88)#33 | 5.4%(+3.02)#4,452 |
| 34. | Tokeneke | 8.3% | 5.5%(+2.81)#34 | 5.4%(+2.96)#4,534 |
| 35. | Poplar Plains | 8.3% | 5.5%(+2.75)#35 | 5.4%(+2.89)#4,664 |
| 36. | Lakes West | 8.2% | 5.5%(+2.68)#36 | 5.4%(+2.82)#4,772 |
| 37. | Lakeville | 8.2% | 5.5%(+2.62)#37 | 5.4%(+2.77)#4,859 |
| 38. | Cheshire Village | 8.1% | 5.5%(+2.61)#38 | 5.4%(+2.76)#4,882 |
| 39. | Moodus | 8.1% | 5.5%(+2.59)#39 | 5.4%(+2.73)#4,925 |
| 40. | Newtown Borough | 8.1% | 5.5%(+2.57)#40 | 5.4%(+2.72)#4,959 |
| 41. | Ball Pond | 8.1% | 5.5%(+2.55)#41 | 5.4%(+2.69)#5,002 |
| 42. | Indian Field | 8.1% | 5.5%(+2.52)#42 | 5.4%(+2.67)#5,049 |
| 43. | Westport | 7.6% | 5.5%(+2.04)#43 | 5.4%(+2.18)#6,021 |
| 44. | Northford | 7.5% | 5.5%(+1.96)#44 | 5.4%(+2.10)#6,195 |
| 45. | East Hampton | 7.5% | 5.5%(+1.92)#45 | 5.4%(+2.06)#6,270 |
| 46. | Pawcatuck | 7.4% | 5.5%(+1.85)#46 | 5.4%(+1.99)#6,456 |
| 47. | Sherwood Manor | 7.2% | 5.5%(+1.72)#47 | 5.4%(+1.86)#6,780 |
| 48. | Moosup | 7.2% | 5.5%(+1.67)#48 | 5.4%(+1.81)#6,926 |
| 49. | Southwood Acres | 7.2% | 5.5%(+1.66)#49 | 5.4%(+1.81)#6,946 |
| 50. | New Hartford Center | 7.2% | 5.5%(+1.62)#50 | 5.4%(+1.77)#7,049 |
| 51. | Litchfield Borough | 7.1% | 5.5%(+1.61)#51 | 5.4%(+1.76)#7,074 |
| 52. | Guilford Center | 7.1% | 5.5%(+1.59)#52 | 5.4%(+1.74)#7,134 |
| 53. | Staples | 7.1% | 5.5%(+1.55)#53 | 5.4%(+1.69)#7,251 |
| 54. | Daniels Farm | 7.1% | 5.5%(+1.53)#54 | 5.4%(+1.68)#7,286 |
| 55. | Crystal Lake | 7.0% | 5.5%(+1.46)#55 | 5.4%(+1.61)#7,461 |
| 56. | Danielson Borough | 7.0% | 5.5%(+1.44)#56 | 5.4%(+1.58)#7,545 |
| 57. | New Preston | 7.0% | 5.5%(+1.42)#57 | 5.4%(+1.56)#7,596 |
| 58. | Lakes East | 6.9% | 5.5%(+1.40)#58 | 5.4%(+1.54)#7,662 |
| 59. | Old Greenwich | 6.9% | 5.5%(+1.39)#59 | 5.4%(+1.53)#7,684 |
| 60. | Broad Brook | 6.9% | 5.5%(+1.35)#60 | 5.4%(+1.50)#7,763 |
| 61. | Poquonock Bridge | 6.9% | 5.5%(+1.35)#61 | 5.4%(+1.50)#7,765 |
| 62. | East | 6.8% | 5.5%(+1.30)#62 | 5.4%(+1.45)#7,903 |
| 63. | Old Mystic | 6.8% | 5.5%(+1.29)#63 | 5.4%(+1.43)#7,937 |
| 64. | Kensington | 6.8% | 5.5%(+1.28)#64 | 5.4%(+1.42)#7,964 |
| 65. | Salmon Brook | 6.7% | 5.5%(+1.20)#65 | 5.4%(+1.35)#8,198 |
| 66. | Candlewood Orchards | 6.7% | 5.5%(+1.19)#66 | 5.4%(+1.33)#8,255 |
| 67. | Lake Pocotopaug | 6.6% | 5.5%(+1.11)#67 | 5.4%(+1.25)#8,513 |
| 68. | Naugatuck Borough | 6.6% | 5.5%(+1.05)#68 | 5.4%(+1.19)#8,714 |
| 69. | East Hartford | 6.5% | 5.5%(+0.992)#69 | 5.4%(+1.14)#8,898 |
| 70. | Ridgefield | 6.5% | 5.5%(+0.977)#70 | 5.4%(+1.12)#8,949 |
| 71. | Terryville | 6.4% | 5.5%(+0.852)#71 | 5.4%(+0.996)#9,389 |
| 72. | East Haven | 6.3% | 5.5%(+0.780)#72 | 5.4%(+0.924)#9,655 |
| 73. | Deep River Center | 6.2% | 5.5%(+0.693)#73 | 5.4%(+0.836)#9,965 |
| 74. | Derby | 6.2% | 5.5%(+0.683)#74 | 5.4%(+0.827)#9,999 |
| 75. | Greenwich | 6.2% | 5.5%(+0.683)#75 | 5.4%(+0.827)#10,001 |
| 76. | Orange | 6.2% | 5.5%(+0.650)#76 | 5.4%(+0.793)#10,117 |
| 77. | Conning Towers Nautilus Park | 6.1% | 5.5%(+0.617)#77 | 5.4%(+0.761)#10,223 |
| 78. | West Hartford | 6.1% | 5.5%(+0.600)#78 | 5.4%(+0.744)#10,284 |
| 79. | Mechanicsville | 6.1% | 5.5%(+0.557)#79 | 5.4%(+0.701)#10,446 |
| 80. | Noroton Heights | 6.1% | 5.5%(+0.541)#80 | 5.4%(+0.685)#10,507 |
| 81. | Oxoboxo River | 6.0% | 5.5%(+0.456)#81 | 5.4%(+0.600)#10,821 |
| 82. | Collinsville | 6.0% | 5.5%(+0.430)#82 | 5.4%(+0.573)#10,918 |
| 83. | Bristol | 6.0% | 5.5%(+0.424)#83 | 5.4%(+0.568)#10,937 |
| 84. | New Milford | 5.9% | 5.5%(+0.394)#84 | 5.4%(+0.538)#11,080 |
| 85. | Hartford | 5.9% | 5.5%(+0.351)#85 | 5.4%(+0.495)#11,246 |
| 86. | Wethersfield | 5.9% | 5.5%(+0.346)#86 | 5.4%(+0.490)#11,290 |
| 87. | Northwest Harwinton | 5.9% | 5.5%(+0.327)#87 | 5.4%(+0.471)#11,359 |
| 88. | South Wilton | 5.9% | 5.5%(+0.326)#88 | 5.4%(+0.470)#11,362 |
| 89. | Waterford | 5.8% | 5.5%(+0.230)#89 | 5.4%(+0.374)#11,754 |
| 90. | North Haven | 5.8% | 5.5%(+0.219)#90 | 5.4%(+0.363)#11,811 |
| 91. | Newington | 5.7% | 5.5%(+0.124)#91 | 5.4%(+0.268)#12,207 |
| 92. | Durham | 5.6% | 5.5%(+0.114)#92 | 5.4%(+0.258)#12,240 |
| 93. | Sandy Hook | 5.6% | 5.5%(+0.107)#93 | 5.4%(+0.251)#12,267 |
| 94. | New Haven | 5.6% | 5.5%(+0.041)#94 | 5.4%(+0.184)#12,549 |
| 95. | Wallingford Center | 5.5% | 5.5%(+0.008)#95 | 5.4%(+0.152)#12,713 |
| 96. | New Britain | 5.5% | 5.5%(+0.006)#96 | 5.4%(+0.150)#12,715 |
| 97. | South Woodstock | 5.5% | 5.5%(-0.028)#97 | 5.4%(+0.116)#12,860 |
| 98. | Colchester | 5.5% | 5.5%(-0.030)#98 | 5.4%(+0.114)#12,866 |
| 99. | Manchester | 5.4% | 5.5%(-0.081)#99 | 5.4%(+0.062)#13,075 |
| 100. | Windsor Locks | 5.4% | 5.5%(-0.084)#100 | 5.4%(+0.060)#13,085 |
Common Questions
What are the Top 10 Cities with the Highest Percentage of Population Enrolled in High School in Connecticut?
Top 10 Cities with the Highest Percentage of Population Enrolled in High School in Connecticut are:
#1
11.0%
#2
10.7%
#3
10.0%
#4
9.9%
#5
9.5%
#6
9.4%
#7
9.3%
#8
9.3%
#9
9.3%
#10
8.6%
What city has the Highest Percentage of Population Enrolled in High School in Connecticut?
Byram has the Highest Percentage of Population Enrolled in High School in Connecticut with 11.0%.
What is the Percentage of Population Enrolled in High School in the State of Connecticut?
Percentage of Population Enrolled in High School in Connecticut is 5.5%.
What is the Percentage of Population Enrolled in High School in the United States?
Percentage of Population Enrolled in High School in the United States is 5.4%.