Cities with the Highest Percentage of Population Enrolled in High School in the United States
RELATED REPORTS & OPTIONS
High School
United States
Compare Cities
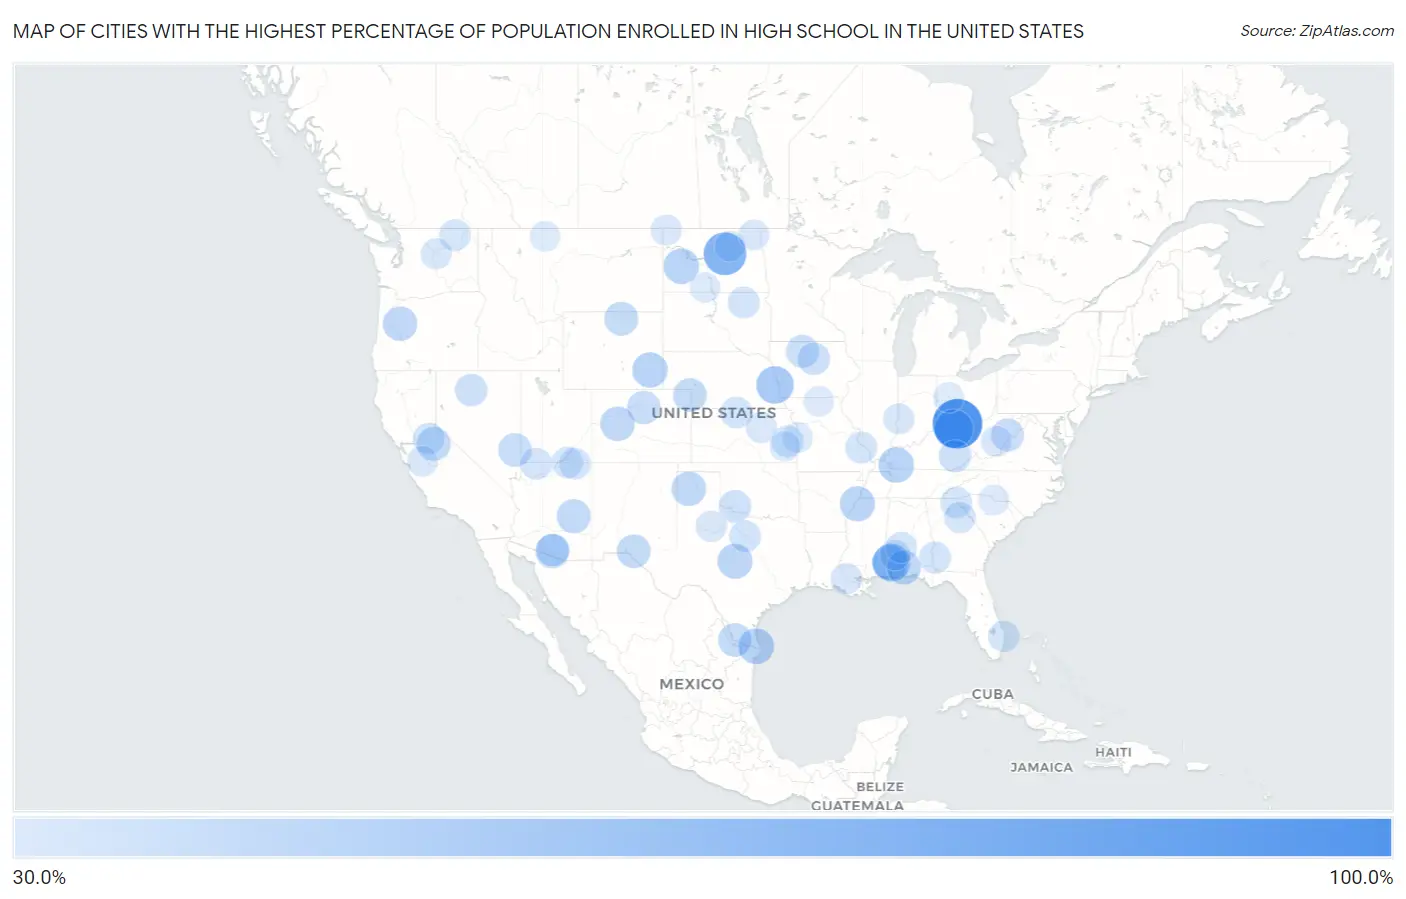
Map of Cities with the Highest Percentage of Population Enrolled in High School in the United States
0.0%
100.0%
Cities with the Highest Percentage of Population Enrolled in High School in the United States
| City | % in High School | vs State | vs National | |
| 1. | Burney | 100.0% | 5.6%(+94.4)#1 | 5.4%(+94.6)#1 |
| 2. | Cynthiana | 100.0% | 5.3%(+94.7)#1 | 5.4%(+94.6)#2 |
| 3. | Chinquapin | 100.0% | 5.3%(+94.7)#1 | 5.4%(+94.6)#3 |
| 4. | Heimdal | 74.4% | 4.8%(+69.6)#1 | 5.4%(+69.0)#4 |
| 5. | Williamstown | 72.5% | 5.2%(+67.3)#1 | 5.4%(+67.1)#5 |
| 6. | Warm Springs | 67.4% | 5.3%(+62.0)#1 | 5.4%(+62.0)#6 |
| 7. | Cherry Fork | 60.0% | 5.3%(+54.7)#2 | 5.4%(+54.6)#7 |
| 8. | Malcolm | 56.8% | 5.3%(+51.5)#1 | 5.4%(+51.4)#8 |
| 9. | Helmville | 55.6% | 4.8%(+50.8)#1 | 5.4%(+50.2)#9 |
| 10. | Boys Town | 55.4% | 5.9%(+49.6)#1 | 5.4%(+50.0)#10 |
| 11. | Buckskin | 52.5% | 5.6%(+47.0)#2 | 5.4%(+47.2)#11 |
| 12. | Boxley | 50.5% | 5.6%(+44.9)#3 | 5.4%(+45.1)#12 |
| 13. | Woodruff | 50.0% | 5.7%(+44.3)#1 | 5.4%(+44.6)#13 |
| 14. | Shelbyville | 49.8% | 6.1%(+43.7)#1 | 5.4%(+44.4)#14 |
| 15. | Chowan Beach | 49.0% | 5.3%(+43.7)#2 | 5.4%(+43.6)#15 |
| 16. | Orason | 48.7% | 6.1%(+42.7)#2 | 5.4%(+43.4)#16 |
| 17. | Burlington | 48.6% | 6.1%(+42.6)#3 | 5.4%(+43.3)#17 |
| 18. | Gracey | 48.1% | 5.2%(+42.9)#1 | 5.4%(+42.7)#18 |
| 19. | Manning | 48.0% | 4.8%(+43.2)#2 | 5.4%(+42.6)#19 |
| 20. | Chugcreek | 47.1% | 5.5%(+41.6)#1 | 5.4%(+41.7)#20 |
| 21. | Fairford | 47.1% | 5.3%(+41.8)#2 | 5.4%(+41.7)#21 |
| 22. | White Oak | 46.6% | 5.5%(+41.1)#1 | 5.4%(+41.2)#22 |
| 23. | Richland Springs | 46.4% | 6.1%(+40.3)#4 | 5.4%(+41.0)#23 |
| 24. | Silverdale | 45.7% | 5.7%(+40.0)#2 | 5.4%(+40.3)#24 |
| 25. | Harperville | 45.5% | 5.5%(+39.9)#2 | 5.4%(+40.1)#25 |
| 26. | Redstone | 44.6% | 5.3%(+39.3)#1 | 5.4%(+39.2)#26 |
| 27. | Boys Ranch | 44.4% | 6.1%(+38.4)#5 | 5.4%(+39.1)#27 |
| 28. | Cascadia | 44.3% | 4.8%(+39.5)#1 | 5.4%(+39.0)#28 |
| 29. | Cobbtown | 43.9% | 4.8%(+39.1)#1 | 5.4%(+38.5)#29 |
| 30. | Carrizo | 42.8% | 5.5%(+37.3)#1 | 5.4%(+37.4)#30 |
| 31. | Ali Chukson | 42.5% | 5.5%(+37.0)#2 | 5.4%(+37.1)#31 |
| 32. | Sierra Village | 42.2% | 5.6%(+36.6)#1 | 5.4%(+36.8)#32 |
| 33. | Big Horn | 41.7% | 5.5%(+36.2)#2 | 5.4%(+36.3)#33 |
| 34. | Butterfield | 41.6% | 6.1%(+35.5)#6 | 5.4%(+36.2)#34 |
| 35. | Amherst | 41.6% | 5.3%(+36.3)#2 | 5.4%(+36.2)#35 |
| 36. | Pena | 41.3% | 6.1%(+35.3)#7 | 5.4%(+35.9)#36 |
| 37. | Bennett Springs | 41.2% | 5.3%(+35.8)#1 | 5.4%(+35.8)#37 |
| 38. | Hogeland | 40.9% | 4.8%(+36.1)#2 | 5.4%(+35.5)#38 |
| 39. | Sugarloaf | 40.7% | 5.3%(+35.4)#3 | 5.4%(+35.3)#39 |
| 40. | Flat | 40.0% | 6.1%(+33.9)#8 | 5.4%(+34.6)#40 |
| 41. | Cottageville | 39.3% | 4.8%(+34.6)#1 | 5.4%(+34.0)#41 |
| 42. | Frank | 39.3% | 4.8%(+34.6)#2 | 5.4%(+34.0)#42 |
| 43. | Irvington | 38.9% | 5.4%(+33.5)#1 | 5.4%(+33.5)#43 |
| 44. | Conasauga | 38.3% | 5.2%(+33.1)#1 | 5.4%(+32.9)#44 |
| 45. | Lockett | 37.9% | 6.1%(+31.8)#9 | 5.4%(+32.5)#45 |
| 46. | Popejoy | 37.5% | 5.4%(+32.1)#2 | 5.4%(+32.1)#46 |
| 47. | Chiawuli Tak | 37.3% | 5.5%(+31.9)#3 | 5.4%(+31.9)#47 |
| 48. | Golconda | 37.1% | 5.3%(+31.7)#2 | 5.4%(+31.7)#48 |
| 49. | Buckhorn | 36.8% | 5.2%(+31.6)#2 | 5.4%(+31.4)#49 |
| 50. | Manitou | 36.6% | 5.6%(+31.0)#1 | 5.4%(+31.2)#50 |
| 51. | Bogue Chitto Cdp Kemper And Neshoba Counties | 35.7% | 5.5%(+30.2)#3 | 5.4%(+30.3)#51 |
| 52. | Tacoma | 35.7% | 5.3%(+30.4)#1 | 5.4%(+30.3)#52 |
| 53. | Bluffton | 35.3% | 5.9%(+29.5)#1 | 5.4%(+29.9)#53 |
| 54. | Barrytown | 35.1% | 5.0%(+30.1)#1 | 5.4%(+29.7)#54 |
| 55. | Cane Beds | 35.0% | 5.5%(+29.5)#4 | 5.4%(+29.6)#55 |
| 56. | Palo Pinto | 34.8% | 6.1%(+28.7)#10 | 5.4%(+29.4)#56 |
| 57. | Bath Corner | 34.8% | 5.3%(+29.4)#1 | 5.4%(+29.4)#57 |
| 58. | Pompeys Pillar | 34.8% | 4.8%(+30.0)#3 | 5.4%(+29.4)#58 |
| 59. | Lovell | 34.7% | 5.6%(+29.1)#2 | 5.4%(+29.3)#59 |
| 60. | Rail Road Flat | 34.6% | 5.6%(+29.0)#2 | 5.4%(+29.2)#60 |
| 61. | Ozora | 34.5% | 5.2%(+29.3)#2 | 5.4%(+29.2)#61 |
| 62. | Athol | 34.4% | 5.7%(+28.7)#3 | 5.4%(+29.0)#62 |
| 63. | Denton | 34.3% | 5.2%(+29.1)#3 | 5.4%(+29.0)#63 |
| 64. | Oljato Monument Valley | 34.2% | 5.5%(+28.8)#5 | 5.4%(+28.9)#64 |
| 65. | Tallulah Falls | 34.2% | 5.9%(+28.3)#2 | 5.4%(+28.8)#65 |
| 66. | Navajo Mountain | 34.0% | 7.1%(+27.0)#1 | 5.4%(+28.7)#66 |
| 67. | Fay | 33.9% | 5.6%(+28.4)#3 | 5.4%(+28.5)#67 |
| 68. | Torboy | 33.9% | 5.0%(+28.9)#1 | 5.4%(+28.5)#68 |
| 69. | Lexington | 33.9% | 5.9%(+28.0)#3 | 5.4%(+28.5)#69 |
| 70. | Welda | 33.7% | 5.7%(+28.0)#4 | 5.4%(+28.4)#70 |
| 71. | Lyndon Center | 33.6% | 4.6%(+28.9)#1 | 5.4%(+28.2)#71 |
| 72. | Boykin | 33.5% | 5.3%(+28.2)#3 | 5.4%(+28.1)#72 |
| 73. | Cloud Lake | 33.3% | 4.8%(+28.5)#2 | 5.4%(+27.9)#73 |
| 74. | Bayou Goula | 33.0% | 5.4%(+27.6)#1 | 5.4%(+27.7)#74 |
| 75. | Pierceville | 33.0% | 5.6%(+27.5)#4 | 5.4%(+27.6)#75 |
| 76. | Paloma | 32.5% | 5.5%(+27.0)#1 | 5.4%(+27.2)#76 |
| 77. | Detroit | 32.4% | 5.7%(+26.7)#5 | 5.4%(+27.0)#77 |
| 78. | Whatley | 32.1% | 5.3%(+26.8)#4 | 5.4%(+26.7)#78 |
| 79. | Chelan Falls | 32.1% | 5.0%(+27.1)#2 | 5.4%(+26.7)#79 |
| 80. | Stone Bluff | 32.1% | 5.6%(+26.5)#5 | 5.4%(+26.7)#80 |
| 81. | Girard | 32.0% | 6.1%(+25.9)#11 | 5.4%(+26.6)#81 |
| 82. | Toad Hop | 32.0% | 5.6%(+26.4)#6 | 5.4%(+26.6)#82 |
| 83. | Abington | 31.8% | 5.6%(+26.2)#7 | 5.4%(+26.4)#83 |
| 84. | Fenwick | 31.6% | 4.8%(+26.8)#3 | 5.4%(+26.2)#84 |
| 85. | Tebbetts | 31.6% | 5.2%(+26.4)#4 | 5.4%(+26.2)#85 |
| 86. | Smithwick | 31.6% | 5.3%(+26.2)#2 | 5.4%(+26.2)#86 |
| 87. | Brinsmade | 31.6% | 4.8%(+26.8)#3 | 5.4%(+26.2)#87 |
| 88. | Fortuna | 31.5% | 4.8%(+26.7)#4 | 5.4%(+26.1)#88 |
| 89. | Oak Hill-Piney | 31.3% | 5.6%(+25.7)#4 | 5.4%(+25.9)#89 |
| 90. | Folsomville | 31.3% | 5.6%(+25.7)#8 | 5.4%(+25.9)#90 |
| 91. | Tula | 31.2% | 5.5%(+25.7)#4 | 5.4%(+25.9)#91 |
| 92. | Volta | 30.8% | 5.6%(+25.2)#3 | 5.4%(+25.4)#92 |
| 93. | Canton City Hensel | 30.8% | 4.8%(+26.0)#5 | 5.4%(+25.4)#93 |
| 94. | Merwin | 30.6% | 5.2%(+25.4)#5 | 5.4%(+25.2)#94 |
| 95. | Jaars | 30.6% | 5.3%(+25.3)#3 | 5.4%(+25.2)#95 |
| 96. | Little Browning | 30.5% | 4.8%(+25.7)#4 | 5.4%(+25.1)#96 |
| 97. | New Hampshire | 30.5% | 5.3%(+25.1)#3 | 5.4%(+25.1)#97 |
| 98. | Pollock | 30.4% | 5.2%(+25.2)#6 | 5.4%(+25.0)#98 |
| 99. | Bassett | 30.4% | 5.7%(+24.7)#6 | 5.4%(+25.0)#99 |
| 100. | Porcupine | 30.2% | 4.8%(+25.4)#6 | 5.4%(+24.8)#100 |
Common Questions
What are the Top 10 Cities with the Highest Percentage of Population Enrolled in High School in the United States?
Top 10 Cities with the Highest Percentage of Population Enrolled in High School in the United States are:
What city has the Highest Percentage of Population Enrolled in High School in the United States?
Cynthiana has the Highest Percentage of Population Enrolled in High School in the United States with 100.0%.
What is the Percentage of Population Enrolled in High School in the United States?
Percentage of Population Enrolled in High School in the United States is 5.4%.