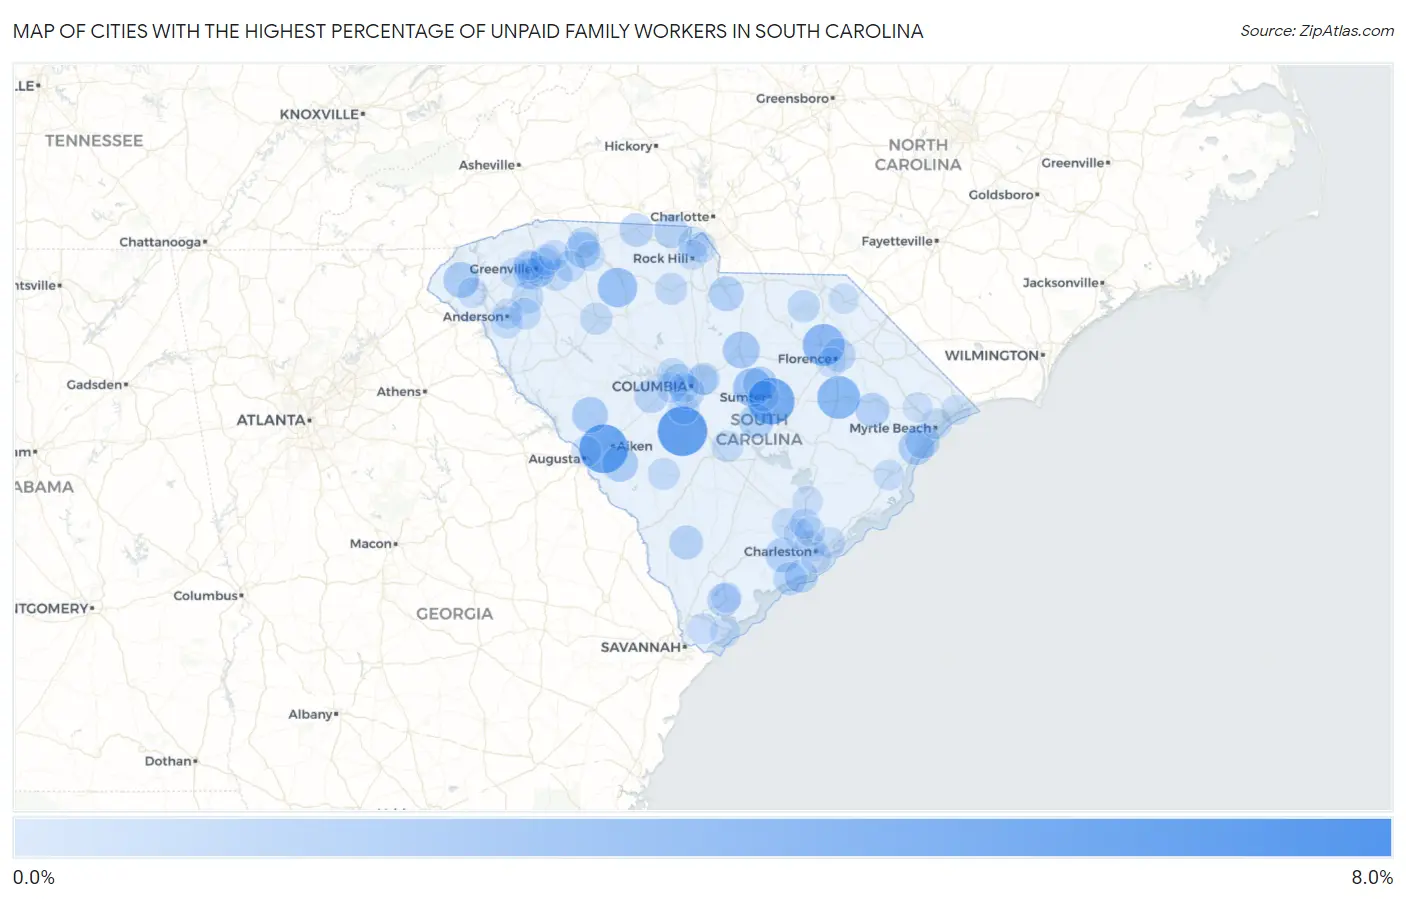
Cities with the Highest Percentage of Unpaid Family Workers in South Carolina
RELATED REPORTS & OPTIONS
Unpaid Family Workers
South Carolina
Compare Cities
Map of Cities with the Highest Percentage of Unpaid Family Workers in South Carolina
0.0%
8.0%
Cities with the Highest Percentage of Unpaid Family Workers in South Carolina
| City | % Unpaid Family Workers | vs State | vs National | |
| 1. | Seabrook | 7.5% | 0.23%(+7.30)#1 | 0.19%(+7.35)#152 |
| 2. | Woodford | 6.0% | 0.23%(+5.74)#2 | 0.19%(+5.78)#197 |
| 3. | Warrenville | 5.7% | 0.23%(+5.44)#3 | 0.19%(+5.49)#206 |
| 4. | South Sumter | 5.1% | 0.23%(+4.85)#4 | 0.19%(+4.89)#240 |
| 5. | Scranton | 3.8% | 0.23%(+3.59)#5 | 0.19%(+3.64)#350 |
| 6. | Darlington | 3.6% | 0.23%(+3.40)#6 | 0.19%(+3.44)#374 |
| 7. | Debordieu Colony | 3.3% | 0.23%(+3.07)#7 | 0.19%(+3.12)#413 |
| 8. | Buffalo | 2.8% | 0.23%(+2.58)#8 | 0.19%(+2.63)#500 |
| 9. | Oakland | 2.6% | 0.23%(+2.35)#9 | 0.19%(+2.39)#559 |
| 10. | Camden | 2.0% | 0.23%(+1.81)#10 | 0.19%(+1.85)#753 |
| 11. | Edgefield | 1.8% | 0.23%(+1.58)#11 | 0.19%(+1.63)#849 |
| 12. | New Ellenton | 1.8% | 0.23%(+1.53)#12 | 0.19%(+1.58)#875 |
| 13. | Walhalla | 1.7% | 0.23%(+1.47)#13 | 0.19%(+1.52)#904 |
| 14. | Murrells Inlet | 1.5% | 0.23%(+1.29)#14 | 0.19%(+1.34)#1,027 |
| 15. | Southern Shops | 1.5% | 0.23%(+1.27)#15 | 0.19%(+1.32)#1,039 |
| 16. | Elgin | 1.4% | 0.23%(+1.20)#16 | 0.19%(+1.25)#1,086 |
| 17. | Pinewood | 1.4% | 0.23%(+1.18)#17 | 0.19%(+1.22)#1,116 |
| 18. | Fripp Island | 1.4% | 0.23%(+1.18)#18 | 0.19%(+1.22)#1,117 |
| 19. | Garden City | 1.3% | 0.23%(+1.07)#19 | 0.19%(+1.12)#1,212 |
| 20. | Hollywood | 1.3% | 0.23%(+1.07)#20 | 0.19%(+1.12)#1,214 |
| 21. | Johnsonville | 1.2% | 0.23%(+0.999)#21 | 0.19%(+1.04)#1,289 |
| 22. | Dalzell | 1.2% | 0.23%(+0.991)#22 | 0.19%(+1.04)#1,301 |
| 23. | Varnville | 1.1% | 0.23%(+0.912)#23 | 0.19%(+0.958)#1,384 |
| 24. | Clover | 1.1% | 0.23%(+0.907)#24 | 0.19%(+0.953)#1,389 |
| 25. | Cayce | 1.1% | 0.23%(+0.832)#25 | 0.19%(+0.877)#1,472 |
| 26. | Blacksburg | 1.1% | 0.23%(+0.830)#26 | 0.19%(+0.876)#1,476 |
| 27. | Gilbert | 1.1% | 0.23%(+0.824)#27 | 0.19%(+0.869)#1,484 |
| 28. | Quinby | 1.1% | 0.23%(+0.823)#28 | 0.19%(+0.869)#1,486 |
| 29. | Burton | 0.96% | 0.23%(+0.728)#29 | 0.19%(+0.774)#1,634 |
| 30. | Seabrook Island | 0.91% | 0.23%(+0.682)#30 | 0.19%(+0.728)#1,707 |
| 31. | Kiawah Island | 0.91% | 0.23%(+0.680)#31 | 0.19%(+0.726)#1,709 |
| 32. | Capitol View | 0.67% | 0.23%(+0.441)#32 | 0.19%(+0.487)#2,195 |
| 33. | Clinton | 0.67% | 0.23%(+0.438)#33 | 0.19%(+0.484)#2,203 |
| 34. | Woodfield | 0.67% | 0.23%(+0.435)#34 | 0.19%(+0.481)#2,209 |
| 35. | Patrick | 0.65% | 0.23%(+0.417)#35 | 0.19%(+0.462)#2,251 |
| 36. | Chester | 0.64% | 0.23%(+0.412)#36 | 0.19%(+0.458)#2,262 |
| 37. | Seven Oaks | 0.63% | 0.23%(+0.399)#37 | 0.19%(+0.445)#2,308 |
| 38. | Dunean | 0.59% | 0.23%(+0.360)#38 | 0.19%(+0.405)#2,417 |
| 39. | West Pelzer | 0.59% | 0.23%(+0.359)#39 | 0.19%(+0.405)#2,420 |
| 40. | Five Forks | 0.59% | 0.23%(+0.357)#40 | 0.19%(+0.403)#2,424 |
| 41. | Homeland Park | 0.57% | 0.23%(+0.339)#41 | 0.19%(+0.385)#2,474 |
| 42. | Blackville | 0.54% | 0.23%(+0.307)#42 | 0.19%(+0.353)#2,601 |
| 43. | Belton | 0.54% | 0.23%(+0.304)#43 | 0.19%(+0.349)#2,613 |
| 44. | Parker | 0.49% | 0.23%(+0.260)#44 | 0.19%(+0.306)#2,785 |
| 45. | Cameron | 0.49% | 0.23%(+0.255)#45 | 0.19%(+0.301)#2,810 |
| 46. | Irmo | 0.45% | 0.23%(+0.222)#46 | 0.19%(+0.268)#2,958 |
| 47. | Tega Cay | 0.43% | 0.23%(+0.194)#47 | 0.19%(+0.240)#3,077 |
| 48. | Wade Hampton | 0.42% | 0.23%(+0.190)#48 | 0.19%(+0.236)#3,087 |
| 49. | Summerville | 0.41% | 0.23%(+0.176)#49 | 0.19%(+0.222)#3,152 |
| 50. | Gaston | 0.39% | 0.23%(+0.160)#50 | 0.19%(+0.206)#3,224 |
| 51. | Boiling Springs | 0.33% | 0.23%(+0.095)#51 | 0.19%(+0.141)#3,563 |
| 52. | Reidville | 0.33% | 0.23%(+0.093)#52 | 0.19%(+0.139)#3,575 |
| 53. | Welcome | 0.32% | 0.23%(+0.087)#53 | 0.19%(+0.133)#3,622 |
| 54. | Taylors | 0.30% | 0.23%(+0.071)#54 | 0.19%(+0.117)#3,715 |
| 55. | Charleston | 0.27% | 0.23%(+0.033)#55 | 0.19%(+0.079)#3,941 |
| 56. | Greenville | 0.26% | 0.23%(+0.029)#56 | 0.19%(+0.075)#3,969 |
| 57. | Myrtle Beach | 0.25% | 0.23%(+0.013)#57 | 0.19%(+0.059)#4,091 |
| 58. | Columbia | 0.24% | 0.23%(+0.008)#58 | 0.19%(+0.054)#4,125 |
| 59. | Sumter | 0.23% | 0.23%(+0.001)#59 | 0.19%(+0.047)#4,191 |
| 60. | Mount Pleasant | 0.22% | 0.23%(-0.015)#60 | 0.19%(+0.031)#4,299 |
| 61. | Georgetown | 0.22% | 0.23%(-0.016)#61 | 0.19%(+0.030)#4,307 |
| 62. | Moncks Corner | 0.18% | 0.23%(-0.057)#62 | 0.19%(-0.011)#4,678 |
| 63. | James Island | 0.17% | 0.23%(-0.060)#63 | 0.19%(-0.014)#4,709 |
| 64. | Bluffton | 0.17% | 0.23%(-0.067)#64 | 0.19%(-0.021)#4,773 |
| 65. | Berea | 0.16% | 0.23%(-0.068)#65 | 0.19%(-0.022)#4,779 |
| 66. | Beaufort | 0.14% | 0.23%(-0.089)#66 | 0.19%(-0.043)#5,012 |
| 67. | Fort Mill | 0.14% | 0.23%(-0.093)#67 | 0.19%(-0.048)#5,059 |
| 68. | North Augusta | 0.13% | 0.23%(-0.098)#68 | 0.19%(-0.052)#5,115 |
| 69. | Seneca | 0.13% | 0.23%(-0.104)#69 | 0.19%(-0.058)#5,182 |
| 70. | North Charleston | 0.11% | 0.23%(-0.128)#70 | 0.19%(-0.082)#5,398 |
| 71. | Hilton Head Island | 0.10% | 0.23%(-0.131)#71 | 0.19%(-0.085)#5,433 |
| 72. | Rock Hill | 0.100% | 0.23%(-0.133)#72 | 0.19%(-0.087)#5,448 |
| 73. | Lexington | 0.100% | 0.23%(-0.133)#73 | 0.19%(-0.087)#5,450 |
| 74. | Anderson | 0.096% | 0.23%(-0.137)#74 | 0.19%(-0.091)#5,493 |
| 75. | Greer | 0.087% | 0.23%(-0.145)#75 | 0.19%(-0.099)#5,572 |
| 76. | Goose Creek | 0.083% | 0.23%(-0.150)#76 | 0.19%(-0.104)#5,605 |
| 77. | Easley | 0.082% | 0.23%(-0.151)#77 | 0.19%(-0.105)#5,622 |
| 78. | Bennettsville | 0.080% | 0.23%(-0.153)#78 | 0.19%(-0.107)#5,638 |
| 79. | Spartanburg | 0.069% | 0.23%(-0.164)#79 | 0.19%(-0.118)#5,730 |
| 80. | West Columbia | 0.055% | 0.23%(-0.178)#80 | 0.19%(-0.132)#5,835 |
| 81. | Conway | 0.053% | 0.23%(-0.179)#81 | 0.19%(-0.133)#5,847 |
| 82. | North Myrtle Beach | 0.052% | 0.23%(-0.181)#82 | 0.19%(-0.135)#5,859 |
| 83. | Florence | 0.039% | 0.23%(-0.193)#83 | 0.19%(-0.148)#5,947 |
| 84. | Hanahan | 0.0097% | 0.23%(-0.223)#84 | 0.19%(-0.177)#6,046 |
Common Questions
What are the Top 10 Cities with the Highest Percentage of Unpaid Family Workers in South Carolina?
Top 10 Cities with the Highest Percentage of Unpaid Family Workers in South Carolina are:
#1
6.0%
#2
5.7%
#3
5.1%
#4
3.8%
#5
3.6%
#6
2.8%
#7
2.6%
#8
2.0%
#9
1.8%
#10
1.8%
What city has the Highest Percentage of Unpaid Family Workers in South Carolina?
Woodford has the Highest Percentage of Unpaid Family Workers in South Carolina with 6.0%.
What is the Percentage of Unpaid Family Workers in the State of South Carolina?
Percentage of Unpaid Family Workers in South Carolina is 0.23%.
What is the Percentage of Unpaid Family Workers in the United States?
Percentage of Unpaid Family Workers in the United States is 0.19%.