Cities with the Highest Percentage of Unpaid Family Workers in New York
RELATED REPORTS & OPTIONS
Unpaid Family Workers
New York
Compare Cities
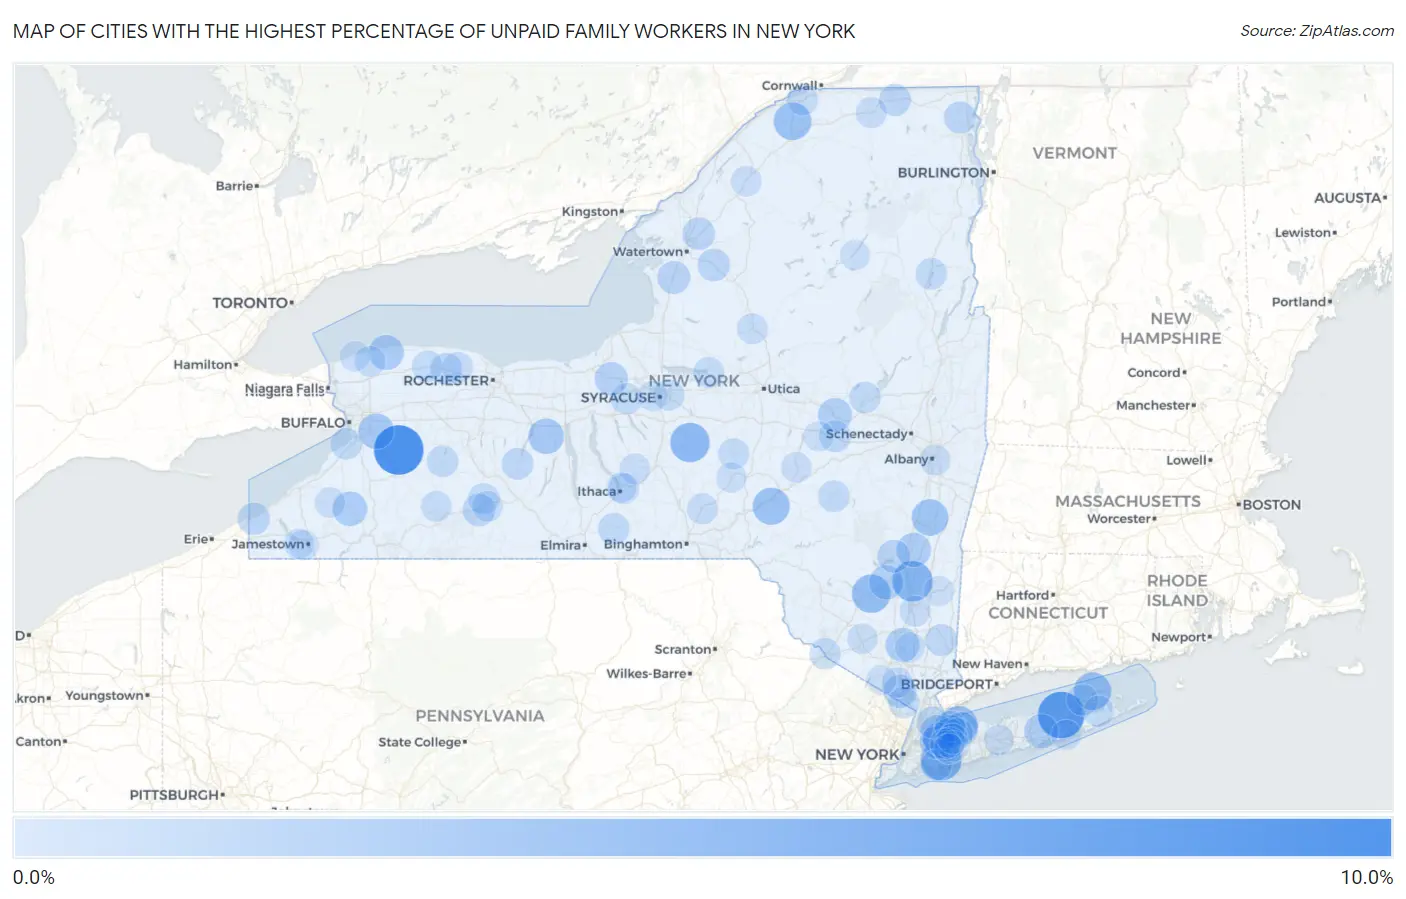
Map of Cities with the Highest Percentage of Unpaid Family Workers in New York
0.0%
10.0%
Cities with the Highest Percentage of Unpaid Family Workers in New York
| City | % Unpaid Family Workers | vs State | vs National | |
| 1. | Strykersville | 9.2% | 0.16%(+8.99)#1 | 0.19%(+8.97)#111 |
| 2. | Northville | 7.8% | 0.16%(+7.66)#2 | 0.19%(+7.64)#142 |
| 3. | Salisbury Center | 7.8% | 0.16%(+7.60)#3 | 0.19%(+7.57)#143 |
| 4. | Wurtsboro Hills | 6.7% | 0.16%(+6.55)#4 | 0.19%(+6.52)#175 |
| 5. | North Lynbrook | 5.3% | 0.16%(+5.15)#5 | 0.19%(+5.13)#223 |
| 6. | Staatsburg | 5.1% | 0.16%(+4.98)#6 | 0.19%(+4.95)#234 |
| 7. | Deruyter | 4.6% | 0.16%(+4.45)#7 | 0.19%(+4.43)#267 |
| 8. | Kerhonkson | 4.3% | 0.16%(+4.10)#8 | 0.19%(+4.07)#303 |
| 9. | Centre Island | 3.9% | 0.16%(+3.77)#9 | 0.19%(+3.75)#331 |
| 10. | East Marion | 3.9% | 0.16%(+3.75)#10 | 0.19%(+3.72)#335 |
| 11. | Norfolk | 3.9% | 0.16%(+3.70)#11 | 0.19%(+3.67)#342 |
| 12. | Franklin | 3.6% | 0.16%(+3.47)#12 | 0.19%(+3.44)#375 |
| 13. | Lorenz Park | 3.4% | 0.16%(+3.24)#13 | 0.19%(+3.22)#399 |
| 14. | Gorham | 3.0% | 0.16%(+2.80)#14 | 0.19%(+2.77)#455 |
| 15. | Elma Center | 2.9% | 0.16%(+2.77)#15 | 0.19%(+2.74)#463 |
| 16. | Barker | 2.7% | 0.16%(+2.57)#16 | 0.19%(+2.55)#523 |
| 17. | Sands Point | 2.7% | 0.16%(+2.53)#17 | 0.19%(+2.51)#535 |
| 18. | Cattaraugus | 2.6% | 0.16%(+2.39)#18 | 0.19%(+2.37)#564 |
| 19. | Tivoli | 2.5% | 0.16%(+2.33)#19 | 0.19%(+2.30)#587 |
| 20. | Manorville | 2.4% | 0.16%(+2.22)#20 | 0.19%(+2.19)#617 |
| 21. | Cornwall On Hudson | 2.3% | 0.16%(+2.18)#21 | 0.19%(+2.16)#636 |
| 22. | Stone Ridge | 2.3% | 0.16%(+2.15)#22 | 0.19%(+2.12)#646 |
| 23. | Cove Neck | 2.3% | 0.16%(+2.13)#23 | 0.19%(+2.10)#654 |
| 24. | Nelliston | 2.3% | 0.16%(+2.11)#24 | 0.19%(+2.09)#659 |
| 25. | Cato | 2.0% | 0.16%(+1.82)#25 | 0.19%(+1.79)#783 |
| 26. | Hillcrest | 1.9% | 0.16%(+1.74)#26 | 0.19%(+1.72)#809 |
| 27. | Adams | 1.9% | 0.16%(+1.70)#27 | 0.19%(+1.67)#832 |
| 28. | Zena | 1.8% | 0.16%(+1.62)#28 | 0.19%(+1.60)#863 |
| 29. | Manhasset | 1.8% | 0.16%(+1.62)#29 | 0.19%(+1.60)#867 |
| 30. | Thomaston | 1.8% | 0.16%(+1.59)#30 | 0.19%(+1.57)#879 |
| 31. | Evans Mills | 1.7% | 0.16%(+1.51)#31 | 0.19%(+1.49)#923 |
| 32. | Almond | 1.7% | 0.16%(+1.51)#32 | 0.19%(+1.48)#929 |
| 33. | Copenhagen | 1.6% | 0.16%(+1.48)#33 | 0.19%(+1.45)#944 |
| 34. | Ripley | 1.6% | 0.16%(+1.42)#34 | 0.19%(+1.40)#987 |
| 35. | Chateaugay | 1.5% | 0.16%(+1.39)#35 | 0.19%(+1.36)#1,007 |
| 36. | West Chazy | 1.5% | 0.16%(+1.37)#36 | 0.19%(+1.34)#1,023 |
| 37. | Matinecock | 1.5% | 0.16%(+1.35)#37 | 0.19%(+1.33)#1,033 |
| 38. | Plandome Manor | 1.5% | 0.16%(+1.31)#38 | 0.19%(+1.29)#1,059 |
| 39. | Sharon Springs | 1.4% | 0.16%(+1.27)#39 | 0.19%(+1.24)#1,092 |
| 40. | Holley | 1.4% | 0.16%(+1.25)#40 | 0.19%(+1.22)#1,113 |
| 41. | Lake Carmel | 1.4% | 0.16%(+1.24)#41 | 0.19%(+1.21)#1,134 |
| 42. | Naples | 1.4% | 0.16%(+1.23)#42 | 0.19%(+1.21)#1,135 |
| 43. | Larchmont | 1.4% | 0.16%(+1.22)#43 | 0.19%(+1.20)#1,146 |
| 44. | Stamford | 1.3% | 0.16%(+1.17)#44 | 0.19%(+1.14)#1,194 |
| 45. | Van Etten | 1.3% | 0.16%(+1.14)#45 | 0.19%(+1.12)#1,218 |
| 46. | Castile | 1.3% | 0.16%(+1.10)#46 | 0.19%(+1.07)#1,262 |
| 47. | Gloversville | 1.3% | 0.16%(+1.10)#47 | 0.19%(+1.07)#1,265 |
| 48. | Schroon Lake | 1.3% | 0.16%(+1.09)#48 | 0.19%(+1.07)#1,272 |
| 49. | Wanakah | 1.2% | 0.16%(+1.06)#49 | 0.19%(+1.04)#1,299 |
| 50. | Port Jervis | 1.2% | 0.16%(+1.05)#50 | 0.19%(+1.02)#1,320 |
| 51. | Southold | 1.2% | 0.16%(+1.04)#51 | 0.19%(+1.02)#1,326 |
| 52. | Pearl River | 1.2% | 0.16%(+1.04)#52 | 0.19%(+1.01)#1,327 |
| 53. | Arkport | 1.2% | 0.16%(+1.02)#53 | 0.19%(+0.999)#1,350 |
| 54. | Elbridge | 1.2% | 0.16%(+1.01)#54 | 0.19%(+0.986)#1,358 |
| 55. | East Syracuse | 1.2% | 0.16%(+1.00)#55 | 0.19%(+0.974)#1,370 |
| 56. | Albion | 1.2% | 0.16%(+0.996)#56 | 0.19%(+0.971)#1,372 |
| 57. | Woodmere | 1.1% | 0.16%(+0.971)#57 | 0.19%(+0.946)#1,399 |
| 58. | Glen Head | 1.1% | 0.16%(+0.965)#58 | 0.19%(+0.939)#1,407 |
| 59. | East Norwich | 1.1% | 0.16%(+0.943)#59 | 0.19%(+0.917)#1,430 |
| 60. | Sag Harbor | 1.1% | 0.16%(+0.938)#60 | 0.19%(+0.912)#1,437 |
| 61. | Sherburne | 1.1% | 0.16%(+0.926)#61 | 0.19%(+0.900)#1,449 |
| 62. | Sylvan Beach | 1.1% | 0.16%(+0.903)#62 | 0.19%(+0.877)#1,473 |
| 63. | Clarkson | 1.1% | 0.16%(+0.896)#63 | 0.19%(+0.870)#1,482 |
| 64. | Malone | 1.0% | 0.16%(+0.889)#64 | 0.19%(+0.863)#1,496 |
| 65. | Greene | 1.0% | 0.16%(+0.855)#65 | 0.19%(+0.829)#1,536 |
| 66. | Spackenkill | 1.00% | 0.16%(+0.835)#66 | 0.19%(+0.810)#1,569 |
| 67. | Newfane | 0.99% | 0.16%(+0.827)#67 | 0.19%(+0.802)#1,583 |
| 68. | Massena | 0.99% | 0.16%(+0.826)#68 | 0.19%(+0.800)#1,586 |
| 69. | Boonville | 0.98% | 0.16%(+0.820)#69 | 0.19%(+0.795)#1,596 |
| 70. | Lattingtown | 0.97% | 0.16%(+0.808)#70 | 0.19%(+0.782)#1,616 |
| 71. | Forest Home | 0.97% | 0.16%(+0.808)#71 | 0.19%(+0.782)#1,617 |
| 72. | Hornell | 0.92% | 0.16%(+0.763)#72 | 0.19%(+0.737)#1,694 |
| 73. | Belfast | 0.92% | 0.16%(+0.762)#73 | 0.19%(+0.736)#1,695 |
| 74. | Richville | 0.91% | 0.16%(+0.748)#74 | 0.19%(+0.722)#1,718 |
| 75. | Groton | 0.90% | 0.16%(+0.743)#75 | 0.19%(+0.718)#1,730 |
| 76. | Islandia | 0.90% | 0.16%(+0.736)#76 | 0.19%(+0.710)#1,743 |
| 77. | East Williston | 0.88% | 0.16%(+0.718)#77 | 0.19%(+0.693)#1,766 |
| 78. | Rensselaer | 0.88% | 0.16%(+0.714)#78 | 0.19%(+0.688)#1,773 |
| 79. | Milford | 0.87% | 0.16%(+0.708)#79 | 0.19%(+0.683)#1,781 |
| 80. | New Cassel | 0.82% | 0.16%(+0.656)#80 | 0.19%(+0.630)#1,871 |
| 81. | Old Westbury | 0.81% | 0.16%(+0.651)#81 | 0.19%(+0.626)#1,879 |
| 82. | Scotchtown | 0.81% | 0.16%(+0.649)#82 | 0.19%(+0.624)#1,882 |
| 83. | Roslyn Heights | 0.81% | 0.16%(+0.648)#83 | 0.19%(+0.622)#1,884 |
| 84. | South Dayton | 0.81% | 0.16%(+0.645)#84 | 0.19%(+0.620)#1,887 |
| 85. | Pomona | 0.78% | 0.16%(+0.622)#85 | 0.19%(+0.596)#1,935 |
| 86. | Jamestown West | 0.77% | 0.16%(+0.610)#86 | 0.19%(+0.584)#1,954 |
| 87. | Tuxedo Park | 0.77% | 0.16%(+0.606)#87 | 0.19%(+0.580)#1,960 |
| 88. | Brookville | 0.77% | 0.16%(+0.605)#88 | 0.19%(+0.580)#1,963 |
| 89. | Millbrook | 0.76% | 0.16%(+0.603)#89 | 0.19%(+0.578)#1,969 |
| 90. | Norwich | 0.75% | 0.16%(+0.590)#90 | 0.19%(+0.564)#2,005 |
| 91. | Long Lake | 0.75% | 0.16%(+0.588)#91 | 0.19%(+0.562)#2,009 |
| 92. | East Quogue | 0.75% | 0.16%(+0.585)#92 | 0.19%(+0.560)#2,017 |
| 93. | Carle Place | 0.75% | 0.16%(+0.585)#93 | 0.19%(+0.560)#2,018 |
| 94. | Wilson | 0.74% | 0.16%(+0.584)#94 | 0.19%(+0.558)#2,020 |
| 95. | Cayuga Heights | 0.74% | 0.16%(+0.579)#95 | 0.19%(+0.553)#2,030 |
| 96. | Cherry Valley | 0.74% | 0.16%(+0.577)#96 | 0.19%(+0.551)#2,036 |
| 97. | Solvay | 0.74% | 0.16%(+0.575)#97 | 0.19%(+0.549)#2,042 |
| 98. | Lakewood | 0.72% | 0.16%(+0.563)#98 | 0.19%(+0.538)#2,078 |
| 99. | Fort Covington | 0.72% | 0.16%(+0.557)#99 | 0.19%(+0.531)#2,091 |
| 100. | Cold Spring | 0.71% | 0.16%(+0.545)#100 | 0.19%(+0.519)#2,122 |
Common Questions
What are the Top 10 Cities with the Highest Percentage of Unpaid Family Workers in New York?
Top 10 Cities with the Highest Percentage of Unpaid Family Workers in New York are:
#1
9.2%
#2
7.8%
#3
5.3%
#4
5.1%
#5
4.6%
#6
4.3%
#7
3.9%
#8
3.9%
#9
3.9%
#10
3.6%
What city has the Highest Percentage of Unpaid Family Workers in New York?
Strykersville has the Highest Percentage of Unpaid Family Workers in New York with 9.2%.
What is the Percentage of Unpaid Family Workers in the State of New York?
Percentage of Unpaid Family Workers in New York is 0.16%.
What is the Percentage of Unpaid Family Workers in the United States?
Percentage of Unpaid Family Workers in the United States is 0.19%.