Cities with the Highest Percentage of Unpaid Family Workers in Texas
RELATED REPORTS & OPTIONS
Unpaid Family Workers
Texas
Compare Cities
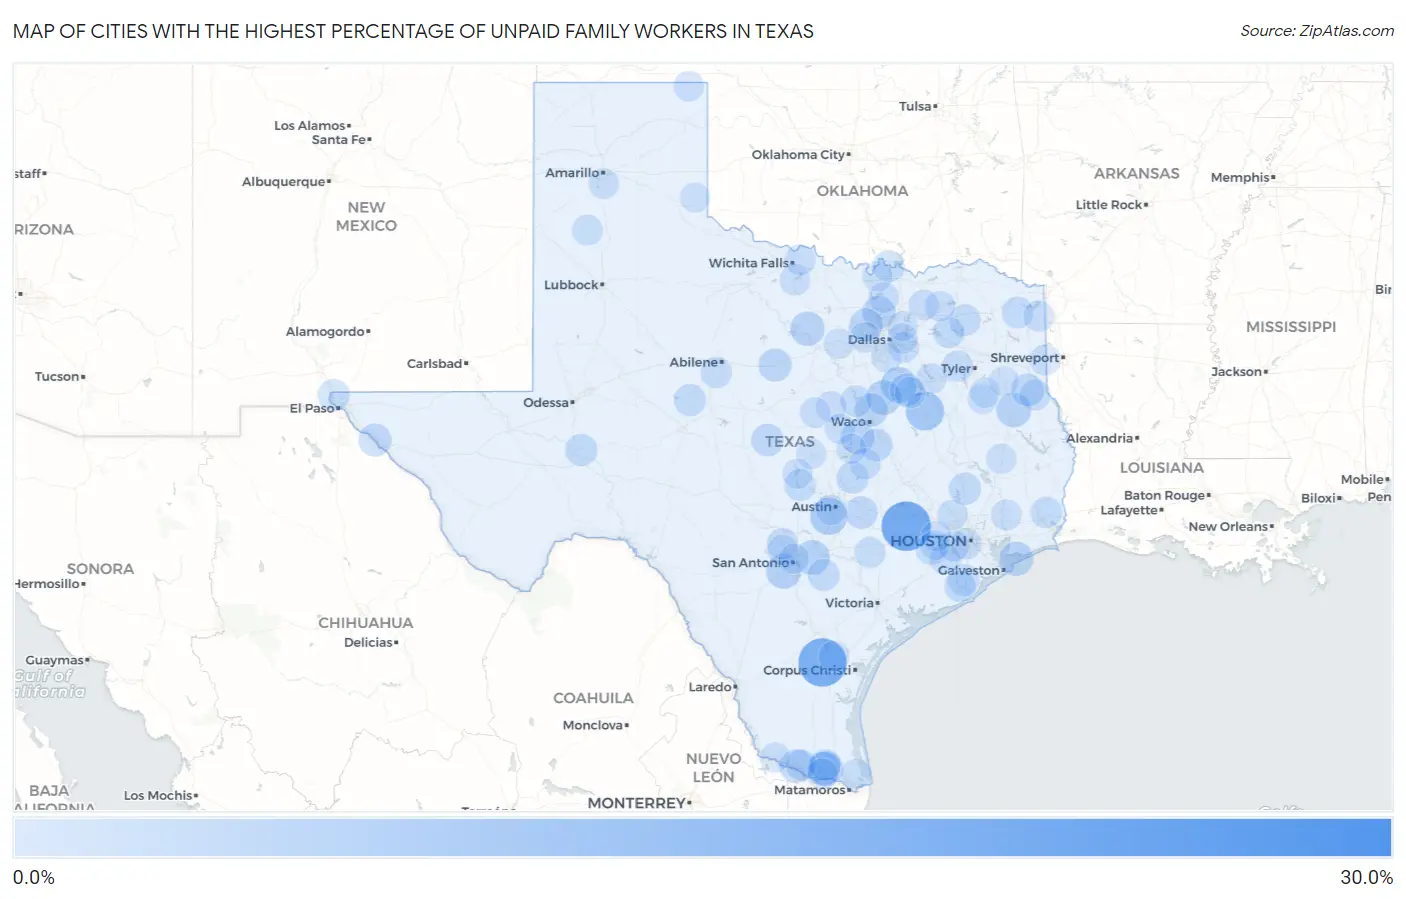
Map of Cities with the Highest Percentage of Unpaid Family Workers in Texas
0.0%
30.0%
Cities with the Highest Percentage of Unpaid Family Workers in Texas
| City | % Unpaid Family Workers | vs State | vs National | |
| 1. | Tow | 28.6% | 0.21%(+28.4)#1 | 0.19%(+28.4)#24 |
| 2. | Industry | 19.3% | 0.21%(+19.1)#2 | 0.19%(+19.1)#46 |
| 3. | Alfred | 18.1% | 0.21%(+17.8)#3 | 0.19%(+17.9)#51 |
| 4. | Red Rock | 11.0% | 0.21%(+10.8)#4 | 0.19%(+10.8)#89 |
| 5. | Fairfield | 8.8% | 0.21%(+8.59)#5 | 0.19%(+8.62)#115 |
| 6. | Hays | 7.5% | 0.21%(+7.34)#6 | 0.19%(+7.36)#150 |
| 7. | Barry | 6.3% | 0.21%(+6.08)#7 | 0.19%(+6.10)#185 |
| 8. | Von Ormy | 5.4% | 0.21%(+5.23)#8 | 0.19%(+5.25)#215 |
| 9. | Malone | 5.3% | 0.21%(+5.11)#9 | 0.19%(+5.13)#222 |
| 10. | Appleby | 5.3% | 0.21%(+5.08)#10 | 0.19%(+5.10)#228 |
| 11. | Sargent | 5.1% | 0.21%(+4.91)#11 | 0.19%(+4.93)#237 |
| 12. | Zuehl | 5.1% | 0.21%(+4.87)#12 | 0.19%(+4.89)#241 |
| 13. | Indian Hills | 5.1% | 0.21%(+4.86)#13 | 0.19%(+4.88)#242 |
| 14. | Graford | 4.9% | 0.21%(+4.65)#14 | 0.19%(+4.67)#257 |
| 15. | Bolivar Peninsula | 4.8% | 0.21%(+4.60)#15 | 0.19%(+4.62)#259 |
| 16. | Penitas | 4.4% | 0.21%(+4.18)#16 | 0.19%(+4.20)#289 |
| 17. | Moody | 4.2% | 0.21%(+4.02)#17 | 0.19%(+4.04)#309 |
| 18. | Mila Doce | 4.2% | 0.21%(+3.99)#18 | 0.19%(+4.01)#313 |
| 19. | Oak Point | 4.0% | 0.21%(+3.77)#19 | 0.19%(+3.79)#330 |
| 20. | Ross | 3.9% | 0.21%(+3.69)#20 | 0.19%(+3.71)#338 |
| 21. | Westlake | 3.8% | 0.21%(+3.64)#21 | 0.19%(+3.66)#344 |
| 22. | Eastland | 3.8% | 0.21%(+3.58)#22 | 0.19%(+3.60)#352 |
| 23. | Fort Hancock | 3.5% | 0.21%(+3.32)#23 | 0.19%(+3.34)#381 |
| 24. | Oak Valley | 3.3% | 0.21%(+3.13)#24 | 0.19%(+3.15)#406 |
| 25. | Gary City | 3.3% | 0.21%(+3.13)#25 | 0.19%(+3.15)#409 |
| 26. | Lott | 3.3% | 0.21%(+3.10)#26 | 0.19%(+3.12)#412 |
| 27. | Camp Swift | 3.3% | 0.21%(+3.07)#27 | 0.19%(+3.10)#415 |
| 28. | Richland Springs | 3.2% | 0.21%(+3.02)#28 | 0.19%(+3.04)#421 |
| 29. | New Waverly | 3.0% | 0.21%(+2.80)#29 | 0.19%(+2.82)#449 |
| 30. | Granger | 3.0% | 0.21%(+2.75)#30 | 0.19%(+2.77)#456 |
| 31. | Mccamey | 2.9% | 0.21%(+2.68)#31 | 0.19%(+2.70)#478 |
| 32. | Bronte | 2.8% | 0.21%(+2.57)#32 | 0.19%(+2.59)#508 |
| 33. | Stockdale | 2.6% | 0.21%(+2.41)#33 | 0.19%(+2.43)#551 |
| 34. | Westway | 2.6% | 0.21%(+2.41)#34 | 0.19%(+2.43)#552 |
| 35. | Granite Shoals | 2.5% | 0.21%(+2.32)#35 | 0.19%(+2.34)#573 |
| 36. | Beaver Creek | 2.5% | 0.21%(+2.32)#36 | 0.19%(+2.34)#574 |
| 37. | Sherwood Shores | 2.5% | 0.21%(+2.26)#37 | 0.19%(+2.28)#595 |
| 38. | Como | 2.4% | 0.21%(+2.24)#38 | 0.19%(+2.26)#598 |
| 39. | Wallis | 2.4% | 0.21%(+2.24)#39 | 0.19%(+2.26)#602 |
| 40. | Marietta | 2.4% | 0.21%(+2.17)#40 | 0.19%(+2.19)#621 |
| 41. | Laguna Park | 2.3% | 0.21%(+2.09)#41 | 0.19%(+2.11)#651 |
| 42. | Emory | 2.2% | 0.21%(+2.02)#42 | 0.19%(+2.04)#669 |
| 43. | Bailey S Prairie | 2.2% | 0.21%(+2.01)#43 | 0.19%(+2.04)#671 |
| 44. | Pine Forest | 2.2% | 0.21%(+2.01)#44 | 0.19%(+2.04)#672 |
| 45. | Laguna Seca | 2.2% | 0.21%(+2.00)#45 | 0.19%(+2.02)#678 |
| 46. | Brazoria | 2.2% | 0.21%(+1.98)#46 | 0.19%(+2.00)#684 |
| 47. | Edom | 2.1% | 0.21%(+1.92)#47 | 0.19%(+1.94)#712 |
| 48. | Buffalo Gap | 2.1% | 0.21%(+1.89)#48 | 0.19%(+1.91)#720 |
| 49. | West Sharyland | 2.0% | 0.21%(+1.83)#49 | 0.19%(+1.85)#748 |
| 50. | Rogers | 2.0% | 0.21%(+1.77)#50 | 0.19%(+1.79)#788 |
| 51. | Scenic Oaks | 1.9% | 0.21%(+1.69)#51 | 0.19%(+1.72)#813 |
| 52. | Southside Place | 1.8% | 0.21%(+1.63)#52 | 0.19%(+1.65)#837 |
| 53. | Pleak | 1.8% | 0.21%(+1.58)#53 | 0.19%(+1.60)#860 |
| 54. | Tenaha | 1.8% | 0.21%(+1.55)#54 | 0.19%(+1.57)#877 |
| 55. | Moulton | 1.7% | 0.21%(+1.53)#55 | 0.19%(+1.55)#892 |
| 56. | Atlanta | 1.7% | 0.21%(+1.49)#56 | 0.19%(+1.51)#910 |
| 57. | Scotland | 1.7% | 0.21%(+1.48)#57 | 0.19%(+1.50)#914 |
| 58. | Hart | 1.7% | 0.21%(+1.46)#58 | 0.19%(+1.48)#925 |
| 59. | Angus | 1.7% | 0.21%(+1.45)#59 | 0.19%(+1.47)#934 |
| 60. | Hardin | 1.6% | 0.21%(+1.36)#60 | 0.19%(+1.38)#994 |
| 61. | Cranfills Gap | 1.6% | 0.21%(+1.36)#61 | 0.19%(+1.38)#995 |
| 62. | Waskom | 1.5% | 0.21%(+1.33)#62 | 0.19%(+1.35)#1,012 |
| 63. | Dean | 1.5% | 0.21%(+1.33)#63 | 0.19%(+1.35)#1,016 |
| 64. | Four Corners | 1.5% | 0.21%(+1.33)#64 | 0.19%(+1.35)#1,021 |
| 65. | Grey Forest | 1.5% | 0.21%(+1.25)#65 | 0.19%(+1.27)#1,072 |
| 66. | San Patricio | 1.4% | 0.21%(+1.22)#66 | 0.19%(+1.24)#1,094 |
| 67. | Commerce | 1.4% | 0.21%(+1.22)#67 | 0.19%(+1.24)#1,100 |
| 68. | Reno City Parker And Tarrant Counties | 1.4% | 0.21%(+1.21)#68 | 0.19%(+1.23)#1,106 |
| 69. | Llano Grande | 1.4% | 0.21%(+1.20)#69 | 0.19%(+1.22)#1,115 |
| 70. | Seagoville | 1.4% | 0.21%(+1.20)#70 | 0.19%(+1.22)#1,125 |
| 71. | Darrouzett | 1.4% | 0.21%(+1.17)#71 | 0.19%(+1.19)#1,152 |
| 72. | Sunnyvale | 1.4% | 0.21%(+1.17)#72 | 0.19%(+1.19)#1,153 |
| 73. | Stagecoach | 1.4% | 0.21%(+1.15)#73 | 0.19%(+1.17)#1,171 |
| 74. | Timbercreek Canyon | 1.4% | 0.21%(+1.14)#74 | 0.19%(+1.16)#1,175 |
| 75. | Celeste | 1.3% | 0.21%(+1.13)#75 | 0.19%(+1.15)#1,184 |
| 76. | Pilot Point | 1.3% | 0.21%(+1.12)#76 | 0.19%(+1.14)#1,199 |
| 77. | South Mountain | 1.3% | 0.21%(+1.09)#77 | 0.19%(+1.11)#1,223 |
| 78. | Hamilton | 1.3% | 0.21%(+1.07)#78 | 0.19%(+1.10)#1,240 |
| 79. | Star Harbor | 1.3% | 0.21%(+1.07)#79 | 0.19%(+1.10)#1,242 |
| 80. | Bushland | 1.3% | 0.21%(+1.07)#80 | 0.19%(+1.09)#1,249 |
| 81. | Pattison | 1.2% | 0.21%(+1.02)#81 | 0.19%(+1.04)#1,290 |
| 82. | Oak Leaf | 1.2% | 0.21%(+1.02)#82 | 0.19%(+1.04)#1,292 |
| 83. | Alamo Heights | 1.2% | 0.21%(+1.02)#83 | 0.19%(+1.04)#1,294 |
| 84. | Rio Grande City | 1.2% | 0.21%(+1.01)#84 | 0.19%(+1.03)#1,313 |
| 85. | Sunset Valley | 1.2% | 0.21%(+0.993)#85 | 0.19%(+1.01)#1,328 |
| 86. | Callisburg | 1.2% | 0.21%(+0.990)#86 | 0.19%(+1.01)#1,334 |
| 87. | Richland Hills | 1.2% | 0.21%(+0.981)#87 | 0.19%(+1.00)#1,346 |
| 88. | Gallatin | 1.2% | 0.21%(+0.969)#88 | 0.19%(+0.990)#1,356 |
| 89. | New Summerfield | 1.2% | 0.21%(+0.959)#89 | 0.19%(+0.979)#1,363 |
| 90. | Corrigan | 1.1% | 0.21%(+0.926)#90 | 0.19%(+0.946)#1,398 |
| 91. | Annetta North | 1.1% | 0.21%(+0.925)#91 | 0.19%(+0.945)#1,402 |
| 92. | Bayview | 1.1% | 0.21%(+0.894)#92 | 0.19%(+0.914)#1,434 |
| 93. | Henderson | 1.1% | 0.21%(+0.887)#93 | 0.19%(+0.907)#1,439 |
| 94. | Lampasas | 1.1% | 0.21%(+0.871)#94 | 0.19%(+0.891)#1,454 |
| 95. | Morgan S Point Resort | 1.1% | 0.21%(+0.868)#95 | 0.19%(+0.888)#1,457 |
| 96. | Simonton | 1.1% | 0.21%(+0.859)#96 | 0.19%(+0.880)#1,468 |
| 97. | Buchanan Dam | 1.1% | 0.21%(+0.843)#97 | 0.19%(+0.864)#1,494 |
| 98. | Stockton Bend | 1.0% | 0.21%(+0.834)#98 | 0.19%(+0.855)#1,508 |
| 99. | Sachse | 1.0% | 0.21%(+0.833)#99 | 0.19%(+0.853)#1,512 |
| 100. | Wellington | 1.0% | 0.21%(+0.806)#100 | 0.19%(+0.827)#1,539 |
Common Questions
What are the Top 10 Cities with the Highest Percentage of Unpaid Family Workers in Texas?
Top 10 Cities with the Highest Percentage of Unpaid Family Workers in Texas are:
What city has the Highest Percentage of Unpaid Family Workers in Texas?
Industry has the Highest Percentage of Unpaid Family Workers in Texas with 19.3%.
What is the Percentage of Unpaid Family Workers in the State of Texas?
Percentage of Unpaid Family Workers in Texas is 0.21%.
What is the Percentage of Unpaid Family Workers in the United States?
Percentage of Unpaid Family Workers in the United States is 0.19%.