Cities with the Highest Percentage of Unpaid Family Workers in Michigan
RELATED REPORTS & OPTIONS
Unpaid Family Workers
Michigan
Compare Cities
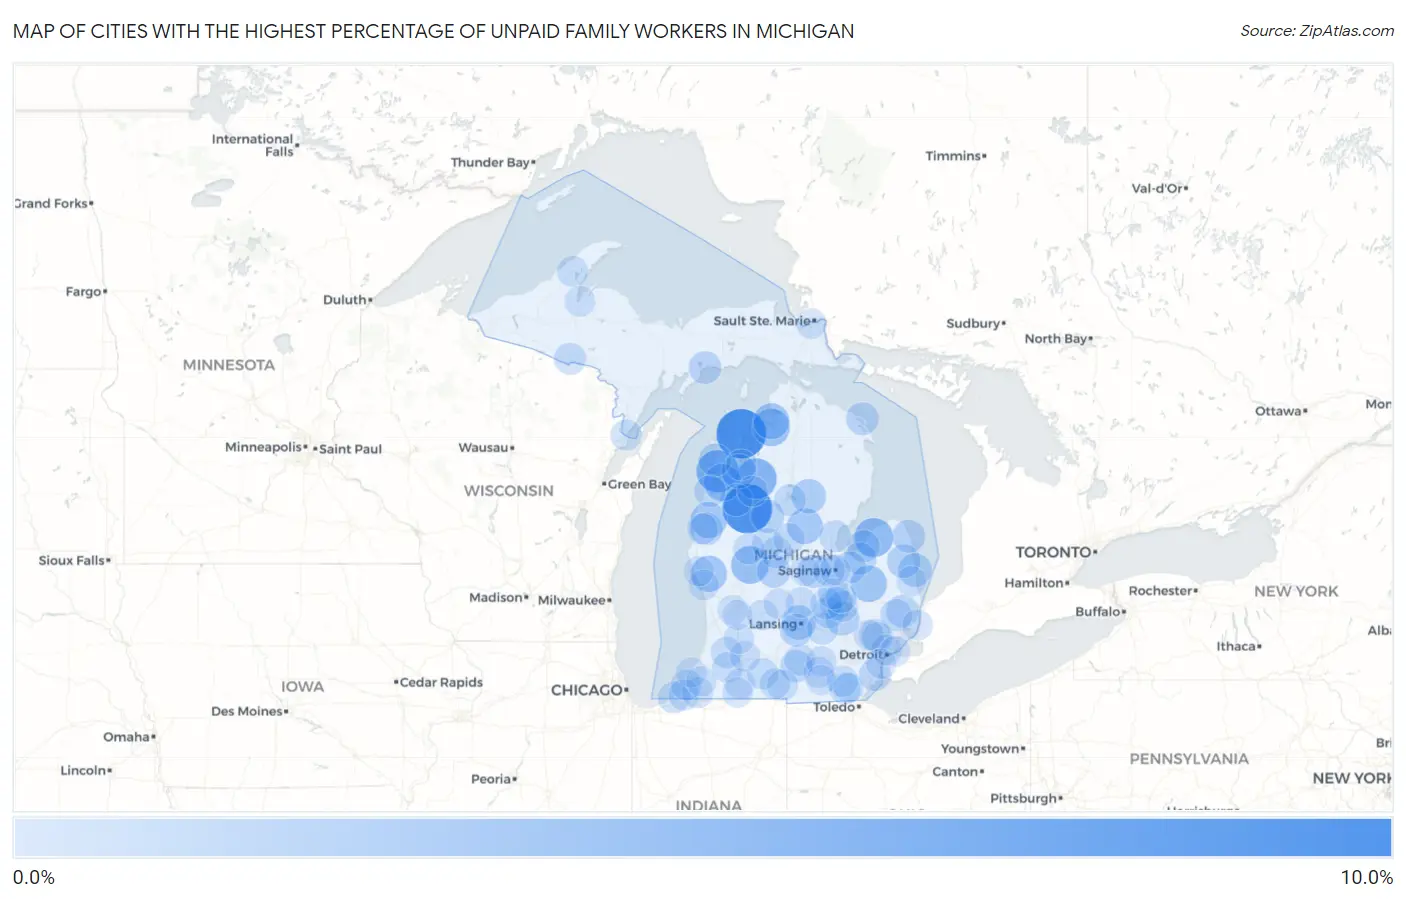
Map of Cities with the Highest Percentage of Unpaid Family Workers in Michigan
0.0%
10.0%
Cities with the Highest Percentage of Unpaid Family Workers in Michigan
| City | % Unpaid Family Workers | vs State | vs National | |
| 1. | Northport | 8.3% | 0.16%(+8.11)#1 | 0.19%(+8.09)#126 |
| 2. | Wedgewood | 8.2% | 0.16%(+8.00)#2 | 0.19%(+7.98)#130 |
| 3. | Riverdale | 7.2% | 0.16%(+7.04)#3 | 0.19%(+7.02)#157 |
| 4. | Honor | 5.2% | 0.16%(+5.01)#4 | 0.19%(+4.99)#231 |
| 5. | Fife Lake | 4.6% | 0.16%(+4.46)#5 | 0.19%(+4.44)#266 |
| 6. | Pigeon | 3.8% | 0.16%(+3.68)#6 | 0.19%(+3.66)#345 |
| 7. | Morley | 3.4% | 0.16%(+3.20)#7 | 0.19%(+3.18)#405 |
| 8. | Thompsonville | 3.2% | 0.16%(+3.00)#8 | 0.19%(+2.98)#431 |
| 9. | Advance | 3.2% | 0.16%(+3.00)#9 | 0.19%(+2.98)#432 |
| 10. | Fostoria | 2.9% | 0.16%(+2.73)#10 | 0.19%(+2.70)#477 |
| 11. | Fountain | 2.7% | 0.16%(+2.58)#11 | 0.19%(+2.55)#522 |
| 12. | Twin Lake | 2.7% | 0.16%(+2.56)#12 | 0.19%(+2.53)#531 |
| 13. | Horton Bay | 2.7% | 0.16%(+2.54)#13 | 0.19%(+2.52)#534 |
| 14. | Gladwin | 2.5% | 0.16%(+2.34)#14 | 0.19%(+2.32)#578 |
| 15. | Chums Corner | 2.0% | 0.16%(+1.88)#15 | 0.19%(+1.86)#746 |
| 16. | St Helen | 2.0% | 0.16%(+1.85)#16 | 0.19%(+1.83)#764 |
| 17. | Edgemont Park | 2.0% | 0.16%(+1.82)#17 | 0.19%(+1.80)#780 |
| 18. | Port Sanilac | 1.7% | 0.16%(+1.57)#18 | 0.19%(+1.54)#893 |
| 19. | Deckerville | 1.7% | 0.16%(+1.50)#19 | 0.19%(+1.48)#932 |
| 20. | Argentine | 1.6% | 0.16%(+1.48)#20 | 0.19%(+1.46)#940 |
| 21. | Marion | 1.5% | 0.16%(+1.38)#21 | 0.19%(+1.35)#1,015 |
| 22. | Merrill | 1.5% | 0.16%(+1.31)#22 | 0.19%(+1.29)#1,058 |
| 23. | Harbor Beach | 1.5% | 0.16%(+1.31)#23 | 0.19%(+1.28)#1,060 |
| 24. | Edmore | 1.5% | 0.16%(+1.31)#24 | 0.19%(+1.28)#1,062 |
| 25. | Empire | 1.4% | 0.16%(+1.21)#25 | 0.19%(+1.18)#1,157 |
| 26. | Custer | 1.4% | 0.16%(+1.20)#26 | 0.19%(+1.17)#1,168 |
| 27. | Presque Isle Harbor | 1.3% | 0.16%(+1.17)#27 | 0.19%(+1.15)#1,188 |
| 28. | Dimondale | 1.3% | 0.16%(+1.17)#28 | 0.19%(+1.14)#1,193 |
| 29. | Manistique | 1.3% | 0.16%(+1.16)#29 | 0.19%(+1.14)#1,200 |
| 30. | Memphis | 1.3% | 0.16%(+1.12)#30 | 0.19%(+1.10)#1,234 |
| 31. | Lennon | 1.2% | 0.16%(+1.03)#31 | 0.19%(+1.01)#1,332 |
| 32. | Akron | 1.2% | 0.16%(+1.03)#32 | 0.19%(+1.01)#1,333 |
| 33. | Rockwood | 1.2% | 0.16%(+1.00)#33 | 0.19%(+0.977)#1,365 |
| 34. | Harrietta | 1.2% | 0.16%(+1.00)#34 | 0.19%(+0.976)#1,368 |
| 35. | Concord | 1.2% | 0.16%(+0.996)#35 | 0.19%(+0.971)#1,371 |
| 36. | Sebewaing | 1.1% | 0.16%(+0.984)#36 | 0.19%(+0.960)#1,381 |
| 37. | Reese | 1.1% | 0.16%(+0.934)#37 | 0.19%(+0.910)#1,438 |
| 38. | Shields | 1.1% | 0.16%(+0.926)#38 | 0.19%(+0.902)#1,447 |
| 39. | Bloomfield Hills | 1.0% | 0.16%(+0.869)#39 | 0.19%(+0.845)#1,524 |
| 40. | Armada | 1.0% | 0.16%(+0.867)#40 | 0.19%(+0.843)#1,528 |
| 41. | Hermansville | 0.99% | 0.16%(+0.827)#41 | 0.19%(+0.803)#1,580 |
| 42. | Lake Isabella | 0.97% | 0.16%(+0.808)#42 | 0.19%(+0.784)#1,614 |
| 43. | Gaastra | 0.96% | 0.16%(+0.799)#43 | 0.19%(+0.775)#1,632 |
| 44. | Bear Lake | 0.94% | 0.16%(+0.781)#44 | 0.19%(+0.757)#1,659 |
| 45. | Houghton Lake | 0.91% | 0.16%(+0.750)#45 | 0.19%(+0.726)#1,708 |
| 46. | Webberville | 0.91% | 0.16%(+0.745)#46 | 0.19%(+0.721)#1,724 |
| 47. | Pinconning | 0.89% | 0.16%(+0.732)#47 | 0.19%(+0.708)#1,748 |
| 48. | Grand Beach | 0.85% | 0.16%(+0.685)#48 | 0.19%(+0.661)#1,819 |
| 49. | Deerfield | 0.82% | 0.16%(+0.659)#49 | 0.19%(+0.634)#1,863 |
| 50. | Bancroft | 0.81% | 0.16%(+0.650)#50 | 0.19%(+0.626)#1,876 |
| 51. | Gobles | 0.77% | 0.16%(+0.609)#51 | 0.19%(+0.585)#1,951 |
| 52. | Corunna | 0.76% | 0.16%(+0.601)#52 | 0.19%(+0.577)#1,971 |
| 53. | Barryton | 0.76% | 0.16%(+0.601)#53 | 0.19%(+0.576)#1,976 |
| 54. | Parma | 0.75% | 0.16%(+0.589)#54 | 0.19%(+0.565)#2,000 |
| 55. | Swartz Creek | 0.72% | 0.16%(+0.559)#55 | 0.19%(+0.535)#2,087 |
| 56. | Athens | 0.72% | 0.16%(+0.553)#56 | 0.19%(+0.529)#2,097 |
| 57. | Britton | 0.71% | 0.16%(+0.552)#57 | 0.19%(+0.527)#2,103 |
| 58. | Clare | 0.71% | 0.16%(+0.549)#58 | 0.19%(+0.525)#2,110 |
| 59. | New Lothrop | 0.69% | 0.16%(+0.529)#59 | 0.19%(+0.505)#2,149 |
| 60. | Menominee | 0.68% | 0.16%(+0.522)#60 | 0.19%(+0.498)#2,163 |
| 61. | Buchanan | 0.67% | 0.16%(+0.512)#61 | 0.19%(+0.488)#2,194 |
| 62. | Quincy | 0.67% | 0.16%(+0.504)#62 | 0.19%(+0.480)#2,212 |
| 63. | Houghton | 0.66% | 0.16%(+0.495)#63 | 0.19%(+0.471)#2,232 |
| 64. | Birmingham | 0.65% | 0.16%(+0.491)#64 | 0.19%(+0.467)#2,243 |
| 65. | Big Rapids | 0.65% | 0.16%(+0.489)#65 | 0.19%(+0.465)#2,246 |
| 66. | Hamtramck | 0.64% | 0.16%(+0.474)#66 | 0.19%(+0.450)#2,290 |
| 67. | Three Oaks | 0.62% | 0.16%(+0.456)#67 | 0.19%(+0.432)#2,341 |
| 68. | Flushing | 0.61% | 0.16%(+0.444)#68 | 0.19%(+0.420)#2,382 |
| 69. | Traverse City | 0.60% | 0.16%(+0.435)#69 | 0.19%(+0.410)#2,407 |
| 70. | Scottville | 0.58% | 0.16%(+0.422)#70 | 0.19%(+0.398)#2,438 |
| 71. | Brooklyn | 0.56% | 0.16%(+0.401)#71 | 0.19%(+0.377)#2,498 |
| 72. | Lawton | 0.56% | 0.16%(+0.396)#72 | 0.19%(+0.372)#2,517 |
| 73. | Bridgman | 0.56% | 0.16%(+0.393)#73 | 0.19%(+0.369)#2,529 |
| 74. | Manton | 0.55% | 0.16%(+0.392)#74 | 0.19%(+0.368)#2,533 |
| 75. | Coldwater | 0.53% | 0.16%(+0.370)#75 | 0.19%(+0.346)#2,628 |
| 76. | St Johns | 0.53% | 0.16%(+0.369)#76 | 0.19%(+0.345)#2,632 |
| 77. | Clarksville | 0.53% | 0.16%(+0.366)#77 | 0.19%(+0.342)#2,638 |
| 78. | L Anse | 0.52% | 0.16%(+0.358)#78 | 0.19%(+0.334)#2,677 |
| 79. | Marine City | 0.51% | 0.16%(+0.345)#79 | 0.19%(+0.321)#2,719 |
| 80. | Eastwood | 0.50% | 0.16%(+0.338)#80 | 0.19%(+0.314)#2,752 |
| 81. | Three Rivers | 0.47% | 0.16%(+0.312)#81 | 0.19%(+0.287)#2,864 |
| 82. | Lyons | 0.46% | 0.16%(+0.299)#82 | 0.19%(+0.275)#2,925 |
| 83. | Grass Lake | 0.46% | 0.16%(+0.295)#83 | 0.19%(+0.270)#2,945 |
| 84. | Muskegon | 0.45% | 0.16%(+0.290)#84 | 0.19%(+0.266)#2,967 |
| 85. | Orchard Lake Village | 0.45% | 0.16%(+0.282)#85 | 0.19%(+0.258)#3,004 |
| 86. | Saginaw | 0.44% | 0.16%(+0.274)#86 | 0.19%(+0.249)#3,045 |
| 87. | Grosse Pointe | 0.43% | 0.16%(+0.271)#87 | 0.19%(+0.247)#3,053 |
| 88. | Martin | 0.41% | 0.16%(+0.249)#88 | 0.19%(+0.225)#3,137 |
| 89. | Sault Ste Marie | 0.40% | 0.16%(+0.241)#89 | 0.19%(+0.217)#3,169 |
| 90. | Constantine | 0.40% | 0.16%(+0.238)#90 | 0.19%(+0.214)#3,186 |
| 91. | Onsted | 0.38% | 0.16%(+0.220)#91 | 0.19%(+0.196)#3,271 |
| 92. | Wyandotte | 0.36% | 0.16%(+0.194)#92 | 0.19%(+0.169)#3,419 |
| 93. | Montague | 0.35% | 0.16%(+0.190)#93 | 0.19%(+0.166)#3,433 |
| 94. | Croswell | 0.35% | 0.16%(+0.187)#94 | 0.19%(+0.162)#3,451 |
| 95. | St Joseph | 0.35% | 0.16%(+0.185)#95 | 0.19%(+0.161)#3,460 |
| 96. | Grandville | 0.34% | 0.16%(+0.180)#96 | 0.19%(+0.156)#3,492 |
| 97. | Cutlerville | 0.34% | 0.16%(+0.178)#97 | 0.19%(+0.154)#3,503 |
| 98. | Eau Claire | 0.34% | 0.16%(+0.173)#98 | 0.19%(+0.149)#3,524 |
| 99. | Breckenridge | 0.33% | 0.16%(+0.172)#99 | 0.19%(+0.148)#3,528 |
| 100. | Petersburg | 0.33% | 0.16%(+0.165)#100 | 0.19%(+0.140)#3,570 |
Common Questions
What are the Top 10 Cities with the Highest Percentage of Unpaid Family Workers in Michigan?
Top 10 Cities with the Highest Percentage of Unpaid Family Workers in Michigan are:
What city has the Highest Percentage of Unpaid Family Workers in Michigan?
Northport has the Highest Percentage of Unpaid Family Workers in Michigan with 8.3%.
What is the Percentage of Unpaid Family Workers in the State of Michigan?
Percentage of Unpaid Family Workers in Michigan is 0.16%.
What is the Percentage of Unpaid Family Workers in the United States?
Percentage of Unpaid Family Workers in the United States is 0.19%.