Cities with the Highest Percentage of Unpaid Family Workers in Florida
RELATED REPORTS & OPTIONS
Unpaid Family Workers
Florida
Compare Cities
Map of Cities with the Highest Percentage of Unpaid Family Workers in Florida
0.0%
15.0%
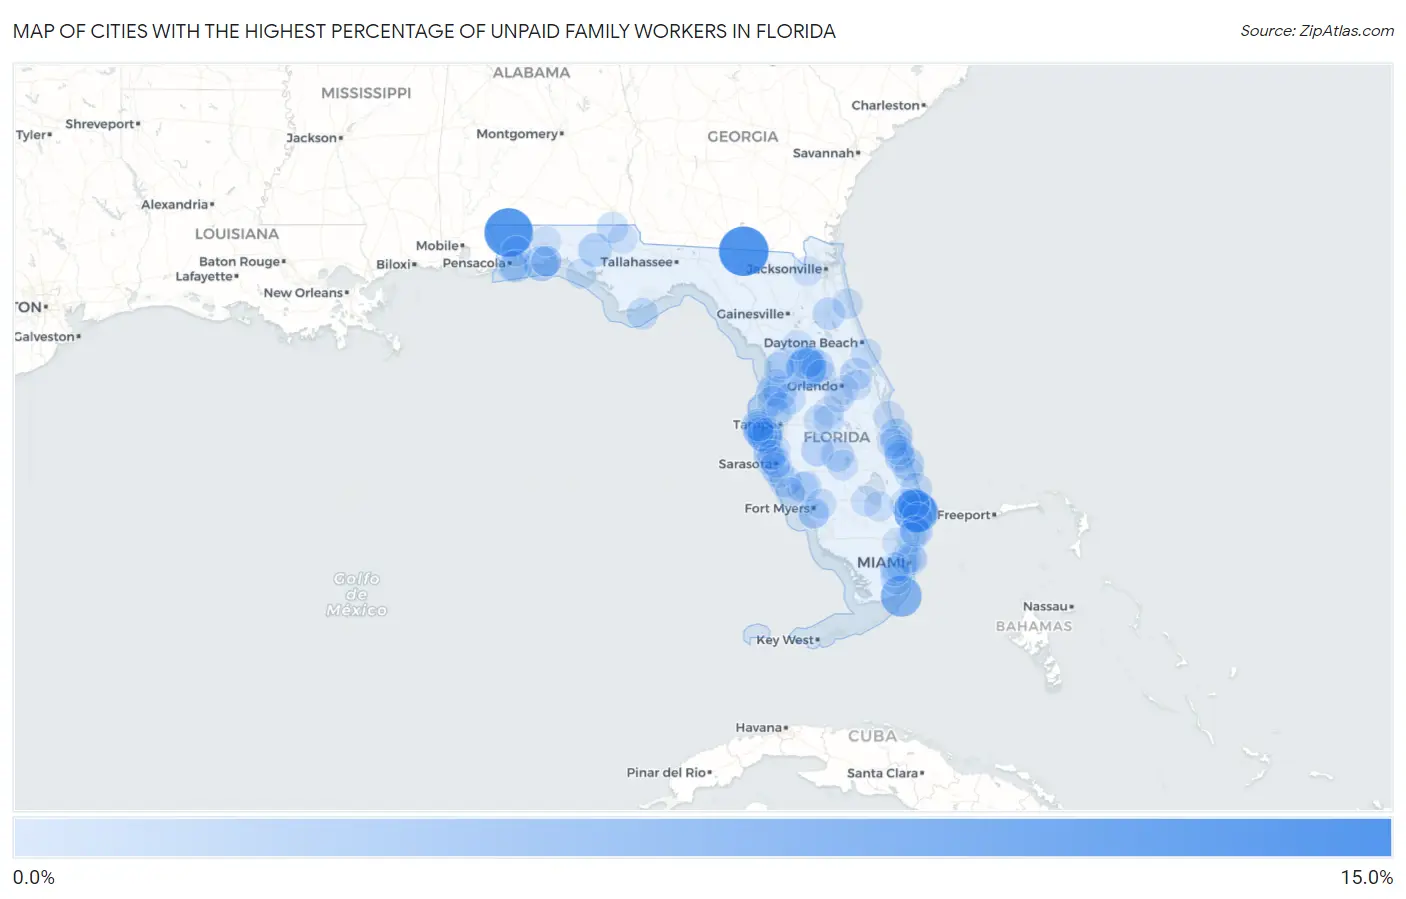
Cities with the Highest Percentage of Unpaid Family Workers in Florida
| City | % Unpaid Family Workers | vs State | vs National | |
| 1. | Jennings | 13.7% | 0.20% (+13.5)#1 | 0.19% (+13.5)#70 |
| 2. | Brownsdale | 13.0% | 0.20% (+12.8)#2 | 0.19% (+12.9)#72 |
| 3. | Winding Cypress | 12.2% | 0.20% (+12.0)#3 | 0.19% (+12.0)#82 |
| 4. | Seminole Manor | 9.0% | 0.20% (+8.84)#4 | 0.19% (+8.85)#113 |
| 5. | North Key Largo | 7.6% | 0.20% (+7.42)#5 | 0.19% (+7.44)#148 |
| 6. | Wildwood | 6.9% | 0.20% (+6.69)#6 | 0.19% (+6.70)#170 |
| 7. | Manalapan | 6.7% | 0.20% (+6.46)#7 | 0.19% (+6.48)#176 |
| 8. | Miccosukee | 4.3% | 0.20% (+4.05)#8 | 0.19% (+4.07)#305 |
| 9. | Mary Esther | 3.7% | 0.20% (+3.49)#9 | 0.19% (+3.50)#367 |
| 10. | Bear Creek | 3.5% | 0.20% (+3.30)#10 | 0.19% (+3.32)#386 |
| 11. | Belleair Shore | 3.4% | 0.20% (+3.25)#11 | 0.19% (+3.26)#395 |
| 12. | Vernon | 2.8% | 0.20% (+2.62)#12 | 0.19% (+2.64)#495 |
| 13. | The Villages | 2.6% | 0.20% (+2.44)#13 | 0.19% (+2.46)#544 |
| 14. | Hutchinson Island South | 2.6% | 0.20% (+2.37)#14 | 0.19% (+2.38)#560 |
| 15. | Orchid | 2.5% | 0.20% (+2.30)#15 | 0.19% (+2.31)#579 |
| 16. | Masaryktown | 2.5% | 0.20% (+2.28)#16 | 0.19% (+2.29)#590 |
| 17. | Sebring | 2.2% | 0.20% (+2.03)#17 | 0.19% (+2.05)#668 |
| 18. | Wauchula | 2.2% | 0.20% (+2.00)#18 | 0.19% (+2.01)#680 |
| 19. | Oriole Beach | 2.1% | 0.20% (+1.85)#19 | 0.19% (+1.87)#739 |
| 20. | Hillsboro Beach | 2.0% | 0.20% (+1.83)#20 | 0.19% (+1.85)#755 |
| 21. | East Palatka | 2.0% | 0.20% (+1.82)#21 | 0.19% (+1.84)#760 |
| 22. | Gulfport | 2.0% | 0.20% (+1.76)#22 | 0.19% (+1.78)#789 |
| 23. | Schall Circle | 2.0% | 0.20% (+1.75)#23 | 0.19% (+1.76)#793 |
| 24. | Marion Oaks | 1.9% | 0.20% (+1.68)#24 | 0.19% (+1.70)#821 |
| 25. | Silver Lake | 1.9% | 0.20% (+1.67)#25 | 0.19% (+1.68)#824 |
| 26. | Haverhill | 1.8% | 0.20% (+1.62)#26 | 0.19% (+1.64)#845 |
| 27. | Geneva | 1.8% | 0.20% (+1.60)#27 | 0.19% (+1.61)#855 |
| 28. | Plantation | 1.8% | 0.20% (+1.59)#28 | 0.19% (+1.61)#858 |
| 29. | Glenvar Heights | 1.5% | 0.20% (+1.35)#29 | 0.19% (+1.36)#1,004 |
| 30. | Jupiter Inlet Colony | 1.5% | 0.20% (+1.29)#30 | 0.19% (+1.31)#1,047 |
| 31. | Rainbow Lakes Estates | 1.4% | 0.20% (+1.24)#31 | 0.19% (+1.25)#1,081 |
| 32. | St George Island | 1.4% | 0.20% (+1.22)#32 | 0.19% (+1.23)#1,104 |
| 33. | Naranja | 1.3% | 0.20% (+1.14)#33 | 0.19% (+1.15)#1,180 |
| 34. | Campbellton | 1.3% | 0.20% (+1.11)#34 | 0.19% (+1.13)#1,207 |
| 35. | North Weeki Wachee | 1.3% | 0.20% (+1.11)#35 | 0.19% (+1.12)#1,211 |
| 36. | Pine Manor | 1.3% | 0.20% (+1.09)#36 | 0.19% (+1.11)#1,227 |
| 37. | Key Vista | 1.3% | 0.20% (+1.09)#37 | 0.19% (+1.10)#1,230 |
| 38. | Gifford | 1.2% | 0.20% (+0.988)#38 | 0.19% (+1.00)#1,340 |
| 39. | Lady Lake | 1.2% | 0.20% (+0.984)#39 | 0.19% (+0.999)#1,347 |
| 40. | Osprey | 1.1% | 0.20% (+0.943)#40 | 0.19% (+0.958)#1,383 |
| 41. | Charlotte Harbor | 1.1% | 0.20% (+0.870)#41 | 0.19% (+0.886)#1,461 |
| 42. | San Antonio | 1.1% | 0.20% (+0.855)#42 | 0.19% (+0.871)#1,481 |
| 43. | Gulf Breeze | 1.0% | 0.20% (+0.843)#43 | 0.19% (+0.858)#1,506 |
| 44. | Timber Pines | 1.0% | 0.20% (+0.833)#44 | 0.19% (+0.848)#1,520 |
| 45. | Gladeview | 1.0% | 0.20% (+0.833)#45 | 0.19% (+0.848)#1,521 |
| 46. | Melbourne Beach | 1.0% | 0.20% (+0.819)#46 | 0.19% (+0.834)#1,531 |
| 47. | Indian Shores | 1.0% | 0.20% (+0.810)#47 | 0.19% (+0.825)#1,542 |
| 48. | Memphis | 0.99% | 0.20% (+0.792)#48 | 0.19% (+0.808)#1,573 |
| 49. | Fort Pierce North | 0.94% | 0.20% (+0.742)#49 | 0.19% (+0.758)#1,655 |
| 50. | Cortez | 0.92% | 0.20% (+0.714)#50 | 0.19% (+0.729)#1,704 |
| 51. | Lake Placid | 0.89% | 0.20% (+0.685)#51 | 0.19% (+0.700)#1,758 |
| 52. | Butler Beach | 0.85% | 0.20% (+0.651)#52 | 0.19% (+0.666)#1,810 |
| 53. | New Smyrna Beach | 0.85% | 0.20% (+0.649)#53 | 0.19% (+0.664)#1,816 |
| 54. | Fort Pierce | 0.83% | 0.20% (+0.630)#54 | 0.19% (+0.645)#1,838 |
| 55. | Harbour Heights | 0.83% | 0.20% (+0.628)#55 | 0.19% (+0.643)#1,842 |
| 56. | Citrus Hills | 0.81% | 0.20% (+0.603)#56 | 0.19% (+0.619)#1,892 |
| 57. | Lealman | 0.80% | 0.20% (+0.597)#57 | 0.19% (+0.613)#1,903 |
| 58. | Longboat Key | 0.79% | 0.20% (+0.592)#58 | 0.19% (+0.607)#1,911 |
| 59. | Moon Lake | 0.79% | 0.20% (+0.590)#59 | 0.19% (+0.605)#1,918 |
| 60. | Lecanto | 0.73% | 0.20% (+0.532)#60 | 0.19% (+0.547)#2,048 |
| 61. | Astatula | 0.73% | 0.20% (+0.531)#61 | 0.19% (+0.546)#2,051 |
| 62. | Clewiston | 0.73% | 0.20% (+0.530)#62 | 0.19% (+0.545)#2,058 |
| 63. | Treasure Island | 0.73% | 0.20% (+0.526)#63 | 0.19% (+0.542)#2,068 |
| 64. | Lake Lorraine | 0.72% | 0.20% (+0.518)#64 | 0.19% (+0.533)#2,088 |
| 65. | Bithlo | 0.71% | 0.20% (+0.503)#65 | 0.19% (+0.518)#2,123 |
| 66. | Redington Shores | 0.70% | 0.20% (+0.500)#66 | 0.19% (+0.515)#2,131 |
| 67. | Pea Ridge | 0.70% | 0.20% (+0.499)#67 | 0.19% (+0.514)#2,132 |
| 68. | Davenport | 0.70% | 0.20% (+0.495)#68 | 0.19% (+0.510)#2,138 |
| 69. | Loxahatchee Groves | 0.67% | 0.20% (+0.468)#69 | 0.19% (+0.483)#2,205 |
| 70. | North Sarasota | 0.67% | 0.20% (+0.468)#70 | 0.19% (+0.483)#2,206 |
| 71. | Fort Myers Shores | 0.66% | 0.20% (+0.459)#71 | 0.19% (+0.474)#2,225 |
| 72. | Northdale | 0.65% | 0.20% (+0.445)#72 | 0.19% (+0.461)#2,257 |
| 73. | Laguna Beach | 0.64% | 0.20% (+0.442)#73 | 0.19% (+0.457)#2,263 |
| 74. | Siesta Key | 0.64% | 0.20% (+0.441)#74 | 0.19% (+0.457)#2,266 |
| 75. | Gulf Stream | 0.64% | 0.20% (+0.441)#75 | 0.19% (+0.456)#2,267 |
| 76. | Dundee | 0.64% | 0.20% (+0.439)#76 | 0.19% (+0.454)#2,272 |
| 77. | Belleair Beach | 0.63% | 0.20% (+0.426)#77 | 0.19% (+0.441)#2,319 |
| 78. | Shalimar | 0.62% | 0.20% (+0.419)#78 | 0.19% (+0.434)#2,334 |
| 79. | Ocala | 0.62% | 0.20% (+0.415)#79 | 0.19% (+0.430)#2,345 |
| 80. | Hunters Creek | 0.62% | 0.20% (+0.414)#80 | 0.19% (+0.429)#2,351 |
| 81. | Rotonda | 0.62% | 0.20% (+0.413)#81 | 0.19% (+0.429)#2,354 |
| 82. | Jan Phyl Village | 0.61% | 0.20% (+0.409)#82 | 0.19% (+0.424)#2,371 |
| 83. | West Vero Corridor | 0.60% | 0.20% (+0.402)#83 | 0.19% (+0.418)#2,388 |
| 84. | Land O Lakes | 0.58% | 0.20% (+0.381)#84 | 0.19% (+0.396)#2,445 |
| 85. | Oakland Park | 0.58% | 0.20% (+0.379)#85 | 0.19% (+0.394)#2,450 |
| 86. | Miami Beach | 0.57% | 0.20% (+0.372)#86 | 0.19% (+0.387)#2,469 |
| 87. | South Bradenton | 0.57% | 0.20% (+0.369)#87 | 0.19% (+0.384)#2,477 |
| 88. | North Bay Village | 0.56% | 0.20% (+0.361)#88 | 0.19% (+0.377)#2,496 |
| 89. | Sewall S Point | 0.56% | 0.20% (+0.355)#89 | 0.19% (+0.371)#2,525 |
| 90. | Weston | 0.55% | 0.20% (+0.345)#90 | 0.19% (+0.360)#2,569 |
| 91. | South Bay | 0.54% | 0.20% (+0.335)#91 | 0.19% (+0.350)#2,609 |
| 92. | Lighthouse Point | 0.53% | 0.20% (+0.331)#92 | 0.19% (+0.346)#2,629 |
| 93. | Kendall West | 0.53% | 0.20% (+0.330)#93 | 0.19% (+0.345)#2,631 |
| 94. | Marianna | 0.53% | 0.20% (+0.327)#94 | 0.19% (+0.342)#2,640 |
| 95. | Lakewood Park | 0.53% | 0.20% (+0.323)#95 | 0.19% (+0.338)#2,656 |
| 96. | Baldwin | 0.52% | 0.20% (+0.322)#96 | 0.19% (+0.337)#2,661 |
| 97. | Villas | 0.52% | 0.20% (+0.321)#97 | 0.19% (+0.336)#2,665 |
| 98. | Country Walk | 0.52% | 0.20% (+0.318)#98 | 0.19% (+0.333)#2,679 |
| 99. | Belle Isle | 0.51% | 0.20% (+0.309)#99 | 0.19% (+0.324)#2,709 |
| 100. | Crestview | 0.49% | 0.20% (+0.290)#100 | 0.19% (+0.306)#2,791 |
Common Questions
What are the Top 10 Cities with the Highest Percentage of Unpaid Family Workers in Florida?
Top 10 Cities with the Highest Percentage of Unpaid Family Workers in Florida are:
#1
13.7%
#2
13.0%
#3
9.0%
#4
7.6%
#5
6.9%
#6
6.7%
#7
3.7%
#8
3.5%
#9
3.4%
#10
2.8%
What city has the Highest Percentage of Unpaid Family Workers in Florida?
Jennings has the Highest Percentage of Unpaid Family Workers in Florida with 13.7%.
What is the Percentage of Unpaid Family Workers in the State of Florida?
Percentage of Unpaid Family Workers in Florida is 0.20%.
What is the Percentage of Unpaid Family Workers in the United States?
Percentage of Unpaid Family Workers in the United States is 0.19%.