Cities with the Highest Percentage of Unpaid Family Workers in Kansas
RELATED REPORTS & OPTIONS
Unpaid Family Workers
Kansas
Compare Cities
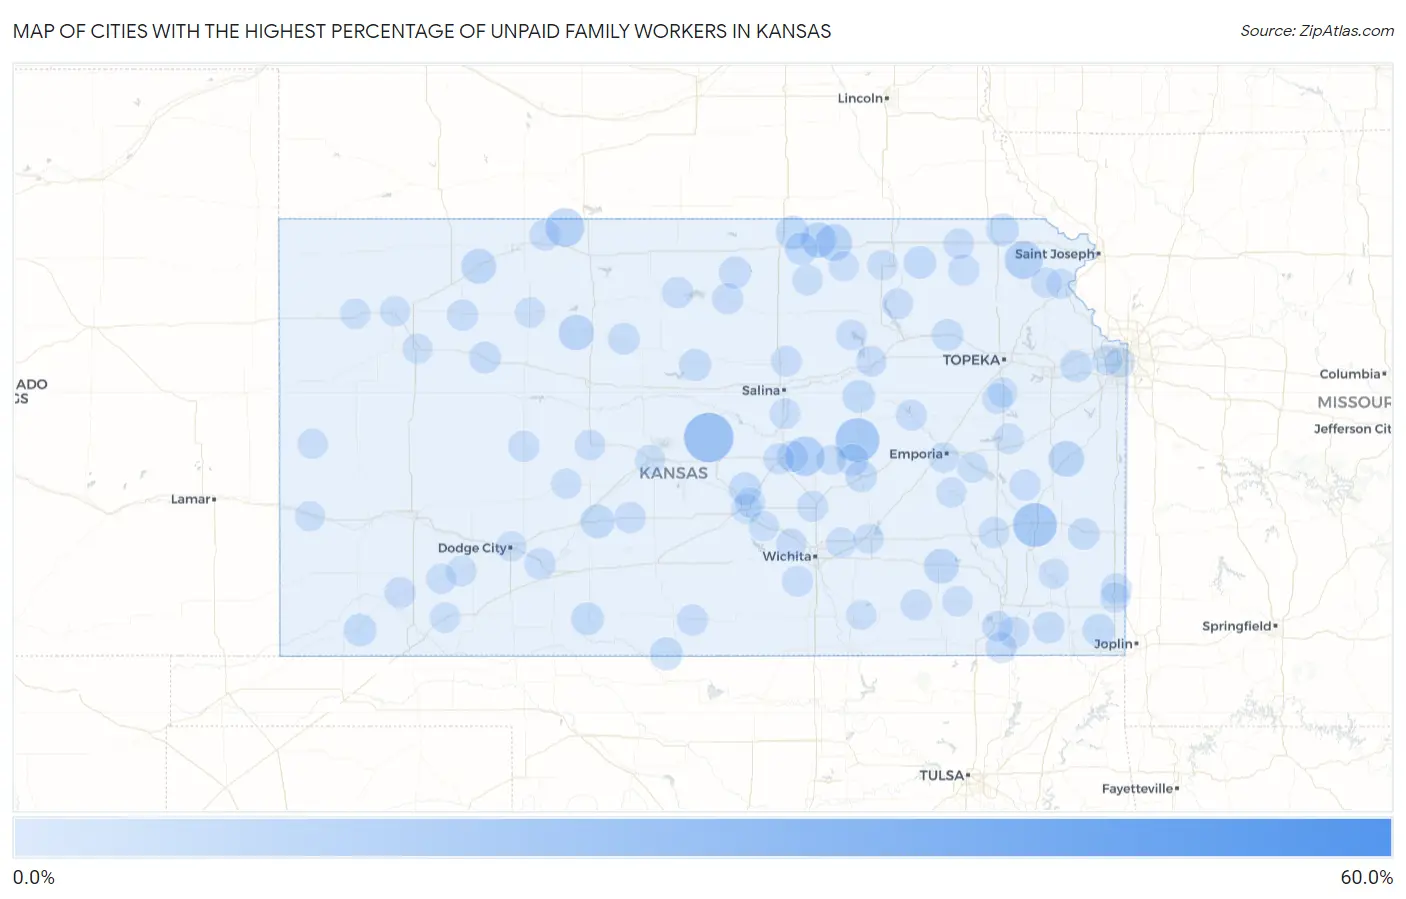
Map of Cities with the Highest Percentage of Unpaid Family Workers in Kansas
0.0%
60.0%
Cities with the Highest Percentage of Unpaid Family Workers in Kansas
| City | % Unpaid Family Workers | vs State | vs National | |
| 1. | Norway | 55.6% | 0.20%(+55.4)#1 | 0.19%(+55.4)#7 |
| 2. | Frederick | 20.0% | 0.20%(+19.8)#2 | 0.19%(+19.8)#44 |
| 3. | Bassett | 14.3% | 0.20%(+14.1)#3 | 0.19%(+14.1)#65 |
| 4. | Lincolnville | 14.1% | 0.20%(+13.9)#4 | 0.19%(+13.9)#66 |
| 5. | Canton | 9.4% | 0.20%(+9.23)#5 | 0.19%(+9.25)#109 |
| 6. | Long Island | 8.9% | 0.20%(+8.73)#6 | 0.19%(+8.74)#114 |
| 7. | Willis | 8.3% | 0.20%(+8.13)#7 | 0.19%(+8.15)#123 |
| 8. | Morrowville | 6.8% | 0.20%(+6.62)#8 | 0.19%(+6.63)#171 |
| 9. | Greeley | 6.0% | 0.20%(+5.77)#9 | 0.19%(+5.78)#196 |
| 10. | Haddam | 5.6% | 0.20%(+5.35)#10 | 0.19%(+5.37)#211 |
| 11. | Zurich | 5.6% | 0.20%(+5.35)#11 | 0.19%(+5.37)#213 |
| 12. | Severy | 5.2% | 0.20%(+5.01)#12 | 0.19%(+5.03)#230 |
| 13. | Jennings | 5.1% | 0.20%(+4.93)#13 | 0.19%(+4.94)#236 |
| 14. | Lewis | 4.1% | 0.20%(+3.89)#14 | 0.19%(+3.90)#322 |
| 15. | Munden | 3.8% | 0.20%(+3.64)#15 | 0.19%(+3.66)#347 |
| 16. | Woodbine | 3.1% | 0.20%(+2.92)#16 | 0.19%(+2.94)#438 |
| 17. | Coldwater | 2.9% | 0.20%(+2.73)#17 | 0.19%(+2.74)#462 |
| 18. | Hardtner | 2.9% | 0.20%(+2.70)#18 | 0.19%(+2.71)#471 |
| 19. | Morrill | 2.9% | 0.20%(+2.70)#19 | 0.19%(+2.71)#474 |
| 20. | The Highlands | 2.9% | 0.20%(+2.69)#20 | 0.19%(+2.71)#476 |
| 21. | Hugoton | 2.8% | 0.20%(+2.61)#21 | 0.19%(+2.62)#502 |
| 22. | Cuba | 2.7% | 0.20%(+2.52)#22 | 0.19%(+2.53)#530 |
| 23. | Frankfort | 2.7% | 0.20%(+2.49)#23 | 0.19%(+2.51)#537 |
| 24. | Greeley County Unified Government (Balance) | 2.7% | 0.20%(+2.46)#24 | 0.19%(+2.47)#543 |
| 25. | Columbus | 2.6% | 0.20%(+2.44)#25 | 0.19%(+2.46)#545 |
| 26. | Sylvan Grove | 2.5% | 0.20%(+2.28)#26 | 0.19%(+2.30)#589 |
| 27. | Randall | 2.4% | 0.20%(+2.18)#27 | 0.19%(+2.19)#619 |
| 28. | Belvue | 2.2% | 0.20%(+1.95)#28 | 0.19%(+1.96)#705 |
| 29. | Marion | 2.0% | 0.20%(+1.83)#29 | 0.19%(+1.85)#757 |
| 30. | Linwood | 2.0% | 0.20%(+1.82)#30 | 0.19%(+1.83)#761 |
| 31. | Quinter | 2.0% | 0.20%(+1.79)#31 | 0.19%(+1.81)#778 |
| 32. | Uniontown | 2.0% | 0.20%(+1.78)#32 | 0.19%(+1.79)#784 |
| 33. | Florence | 1.9% | 0.20%(+1.73)#33 | 0.19%(+1.75)#800 |
| 34. | Altamont | 1.9% | 0.20%(+1.68)#34 | 0.19%(+1.70)#820 |
| 35. | Natoma | 1.9% | 0.20%(+1.66)#35 | 0.19%(+1.68)#830 |
| 36. | Ford | 1.7% | 0.20%(+1.45)#36 | 0.19%(+1.47)#937 |
| 37. | Macksville | 1.6% | 0.20%(+1.42)#37 | 0.19%(+1.44)#957 |
| 38. | Downs | 1.6% | 0.20%(+1.40)#38 | 0.19%(+1.42)#971 |
| 39. | Satanta | 1.5% | 0.20%(+1.34)#39 | 0.19%(+1.36)#1,010 |
| 40. | Liberty | 1.5% | 0.20%(+1.34)#40 | 0.19%(+1.35)#1,018 |
| 41. | Sharon | 1.5% | 0.20%(+1.29)#41 | 0.19%(+1.31)#1,051 |
| 42. | Almena | 1.4% | 0.20%(+1.23)#42 | 0.19%(+1.24)#1,093 |
| 43. | Grenola | 1.4% | 0.20%(+1.23)#43 | 0.19%(+1.24)#1,096 |
| 44. | Westphalia | 1.4% | 0.20%(+1.21)#44 | 0.19%(+1.22)#1,120 |
| 45. | Beloit | 1.4% | 0.20%(+1.20)#45 | 0.19%(+1.22)#1,127 |
| 46. | Newton | 1.4% | 0.20%(+1.18)#46 | 0.19%(+1.20)#1,148 |
| 47. | Hoxie | 1.4% | 0.20%(+1.15)#47 | 0.19%(+1.16)#1,173 |
| 48. | Galva | 1.3% | 0.20%(+1.14)#48 | 0.19%(+1.16)#1,176 |
| 49. | Ness City | 1.3% | 0.20%(+1.13)#49 | 0.19%(+1.15)#1,185 |
| 50. | Corning | 1.2% | 0.20%(+1.02)#50 | 0.19%(+1.03)#1,310 |
| 51. | Dearing | 1.2% | 0.20%(+1.00)#51 | 0.19%(+1.02)#1,323 |
| 52. | Council Grove | 1.2% | 0.20%(+0.982)#52 | 0.19%(+0.998)#1,351 |
| 53. | Frontenac | 1.2% | 0.20%(+0.970)#53 | 0.19%(+0.987)#1,357 |
| 54. | Mcpherson | 1.2% | 0.20%(+0.951)#54 | 0.19%(+0.968)#1,373 |
| 55. | Yates Center | 1.1% | 0.20%(+0.919)#55 | 0.19%(+0.935)#1,411 |
| 56. | Bennington | 1.1% | 0.20%(+0.857)#56 | 0.19%(+0.873)#1,478 |
| 57. | Clearwater | 1.1% | 0.20%(+0.854)#57 | 0.19%(+0.870)#1,483 |
| 58. | Independence | 0.99% | 0.20%(+0.782)#58 | 0.19%(+0.798)#1,589 |
| 59. | Olsburg | 0.96% | 0.20%(+0.758)#59 | 0.19%(+0.775)#1,633 |
| 60. | Clyde | 0.93% | 0.20%(+0.729)#60 | 0.19%(+0.745)#1,678 |
| 61. | Wakefield | 0.93% | 0.20%(+0.726)#61 | 0.19%(+0.742)#1,683 |
| 62. | Colwich | 0.91% | 0.20%(+0.705)#62 | 0.19%(+0.721)#1,723 |
| 63. | Junction City | 0.91% | 0.20%(+0.703)#63 | 0.19%(+0.719)#1,726 |
| 64. | Seneca | 0.90% | 0.20%(+0.698)#64 | 0.19%(+0.714)#1,735 |
| 65. | Assaria | 0.85% | 0.20%(+0.644)#65 | 0.19%(+0.661)#1,818 |
| 66. | Rush Center | 0.78% | 0.20%(+0.572)#66 | 0.19%(+0.588)#1,948 |
| 67. | Longton | 0.75% | 0.20%(+0.549)#67 | 0.19%(+0.565)#2,002 |
| 68. | Montezuma | 0.73% | 0.20%(+0.530)#68 | 0.19%(+0.547)#2,050 |
| 69. | Melvern | 0.73% | 0.20%(+0.527)#69 | 0.19%(+0.543)#2,061 |
| 70. | Plains | 0.68% | 0.20%(+0.479)#70 | 0.19%(+0.496)#2,168 |
| 71. | Hill City | 0.65% | 0.20%(+0.445)#71 | 0.19%(+0.462)#2,253 |
| 72. | Burdett | 0.64% | 0.20%(+0.434)#72 | 0.19%(+0.450)#2,288 |
| 73. | Tribune | 0.61% | 0.20%(+0.412)#73 | 0.19%(+0.428)#2,358 |
| 74. | Mission | 0.58% | 0.20%(+0.374)#74 | 0.19%(+0.391)#2,460 |
| 75. | Scranton | 0.57% | 0.20%(+0.368)#75 | 0.19%(+0.385)#2,475 |
| 76. | Colby | 0.55% | 0.20%(+0.349)#76 | 0.19%(+0.365)#2,547 |
| 77. | Copeland | 0.55% | 0.20%(+0.343)#77 | 0.19%(+0.360)#2,574 |
| 78. | Brewster | 0.54% | 0.20%(+0.337)#78 | 0.19%(+0.354)#2,595 |
| 79. | South Hutchinson | 0.52% | 0.20%(+0.320)#79 | 0.19%(+0.336)#2,667 |
| 80. | Great Bend | 0.52% | 0.20%(+0.317)#80 | 0.19%(+0.333)#2,680 |
| 81. | Waterville | 0.51% | 0.20%(+0.311)#81 | 0.19%(+0.327)#2,701 |
| 82. | Lancaster | 0.51% | 0.20%(+0.304)#82 | 0.19%(+0.321)#2,725 |
| 83. | Hutchinson | 0.51% | 0.20%(+0.304)#83 | 0.19%(+0.321)#2,727 |
| 84. | Haven | 0.50% | 0.20%(+0.298)#84 | 0.19%(+0.314)#2,749 |
| 85. | Lake Quivira | 0.50% | 0.20%(+0.297)#85 | 0.19%(+0.313)#2,754 |
| 86. | Hartford | 0.47% | 0.20%(+0.271)#86 | 0.19%(+0.287)#2,869 |
| 87. | Syracuse | 0.47% | 0.20%(+0.270)#87 | 0.19%(+0.286)#2,874 |
| 88. | Linn | 0.47% | 0.20%(+0.269)#88 | 0.19%(+0.285)#2,882 |
| 89. | Atchison | 0.46% | 0.20%(+0.259)#89 | 0.19%(+0.275)#2,923 |
| 90. | Madison | 0.44% | 0.20%(+0.240)#90 | 0.19%(+0.257)#3,013 |
| 91. | Carbondale | 0.43% | 0.20%(+0.227)#91 | 0.19%(+0.244)#3,065 |
| 92. | Emporia | 0.40% | 0.20%(+0.200)#92 | 0.19%(+0.216)#3,174 |
| 93. | El Dorado | 0.39% | 0.20%(+0.192)#93 | 0.19%(+0.208)#3,209 |
| 94. | Benton | 0.38% | 0.20%(+0.179)#94 | 0.19%(+0.196)#3,277 |
| 95. | Oakley | 0.38% | 0.20%(+0.174)#95 | 0.19%(+0.190)#3,305 |
| 96. | Erie | 0.38% | 0.20%(+0.172)#96 | 0.19%(+0.188)#3,312 |
| 97. | Pittsburg | 0.36% | 0.20%(+0.152)#97 | 0.19%(+0.168)#3,422 |
| 98. | Dodge City | 0.35% | 0.20%(+0.150)#98 | 0.19%(+0.166)#3,436 |
| 99. | Hillsboro | 0.32% | 0.20%(+0.119)#99 | 0.19%(+0.135)#3,605 |
| 100. | Winfield | 0.30% | 0.20%(+0.101)#100 | 0.19%(+0.117)#3,714 |
Common Questions
What are the Top 10 Cities with the Highest Percentage of Unpaid Family Workers in Kansas?
Top 10 Cities with the Highest Percentage of Unpaid Family Workers in Kansas are:
#1
20.0%
#2
14.3%
#3
14.1%
#4
9.4%
#5
8.9%
#6
8.3%
#7
6.8%
#8
6.0%
#9
5.6%
#10
5.6%
What city has the Highest Percentage of Unpaid Family Workers in Kansas?
Frederick has the Highest Percentage of Unpaid Family Workers in Kansas with 20.0%.
What is the Percentage of Unpaid Family Workers in the State of Kansas?
Percentage of Unpaid Family Workers in Kansas is 0.20%.
What is the Percentage of Unpaid Family Workers in the United States?
Percentage of Unpaid Family Workers in the United States is 0.19%.