Cities with the Highest Percentage of Unpaid Family Workers in Virginia
RELATED REPORTS & OPTIONS
Unpaid Family Workers
Virginia
Compare Cities
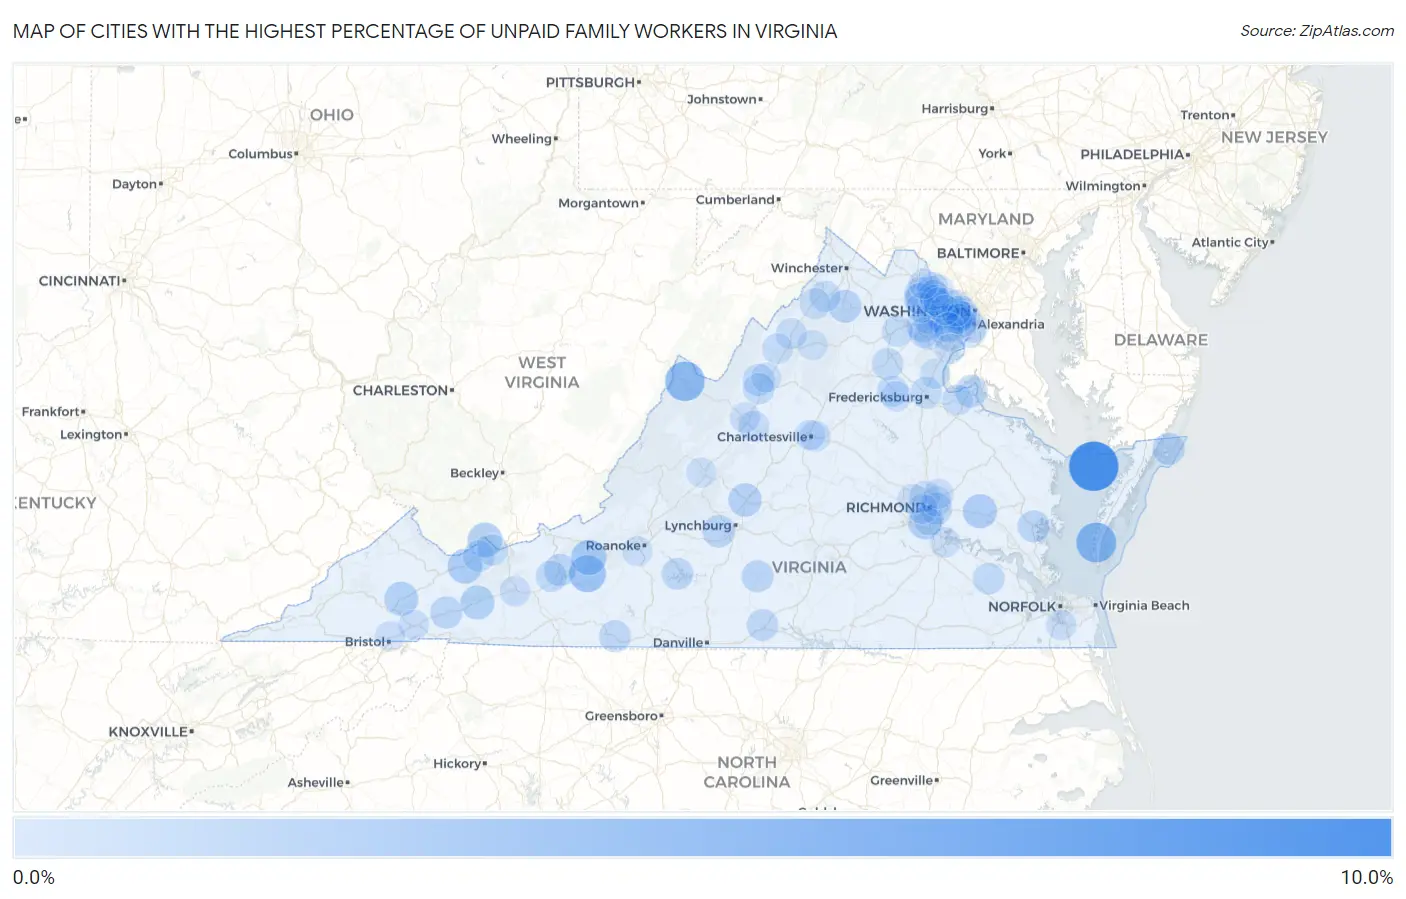
Map of Cities with the Highest Percentage of Unpaid Family Workers in Virginia
0.0%
10.0%
Cities with the Highest Percentage of Unpaid Family Workers in Virginia
| City | % Unpaid Family Workers | vs State | vs National | |
| 1. | Tangier | 8.6% | 0.16%(+8.44)#1 | 0.19%(+8.42)#116 |
| 2. | Rio | 5.1% | 0.16%(+4.95)#2 | 0.19%(+4.92)#238 |
| 3. | Cheriton | 4.3% | 0.16%(+4.16)#3 | 0.19%(+4.14)#298 |
| 4. | Monterey | 4.2% | 0.16%(+4.00)#4 | 0.19%(+3.98)#315 |
| 5. | Riner | 3.0% | 0.16%(+2.83)#5 | 0.19%(+2.81)#453 |
| 6. | Sully Square | 2.5% | 0.16%(+2.38)#6 | 0.19%(+2.36)#565 |
| 7. | Merrimac | 2.3% | 0.16%(+2.18)#7 | 0.19%(+2.16)#633 |
| 8. | Pocahontas | 2.1% | 0.16%(+1.92)#8 | 0.19%(+1.90)#727 |
| 9. | Tazewell | 2.1% | 0.16%(+1.89)#9 | 0.19%(+1.87)#744 |
| 10. | New Kent | 1.8% | 0.16%(+1.66)#10 | 0.19%(+1.64)#844 |
| 11. | Falls Church | 1.8% | 0.16%(+1.61)#11 | 0.19%(+1.59)#871 |
| 12. | Lebanon | 1.7% | 0.16%(+1.58)#12 | 0.19%(+1.56)#883 |
| 13. | Atkins | 1.7% | 0.16%(+1.58)#13 | 0.19%(+1.56)#885 |
| 14. | Meadowbrook | 1.6% | 0.16%(+1.47)#14 | 0.19%(+1.45)#943 |
| 15. | Amherst | 1.5% | 0.16%(+1.37)#15 | 0.19%(+1.35)#1,014 |
| 16. | Front Royal | 1.3% | 0.16%(+1.12)#16 | 0.19%(+1.09)#1,246 |
| 17. | Dahlgren | 1.2% | 0.16%(+1.02)#17 | 0.19%(+0.995)#1,353 |
| 18. | Forest | 1.1% | 0.16%(+0.975)#18 | 0.19%(+0.953)#1,390 |
| 19. | Chincoteague | 1.0% | 0.16%(+0.870)#19 | 0.19%(+0.848)#1,522 |
| 20. | Chilhowie | 1.0% | 0.16%(+0.865)#20 | 0.19%(+0.843)#1,526 |
| 21. | Sudley | 1.0% | 0.16%(+0.846)#21 | 0.19%(+0.824)#1,543 |
| 22. | Gloucester Courthouse | 1.0% | 0.16%(+0.840)#22 | 0.19%(+0.818)#1,553 |
| 23. | Loudoun Valley Estates | 0.96% | 0.16%(+0.799)#23 | 0.19%(+0.777)#1,625 |
| 24. | Brookneal | 0.96% | 0.16%(+0.794)#24 | 0.19%(+0.772)#1,637 |
| 25. | Dublin | 0.95% | 0.16%(+0.787)#25 | 0.19%(+0.766)#1,645 |
| 26. | Dayton | 0.94% | 0.16%(+0.771)#26 | 0.19%(+0.749)#1,673 |
| 27. | Patrick Springs | 0.93% | 0.16%(+0.766)#27 | 0.19%(+0.744)#1,679 |
| 28. | Montrose | 0.89% | 0.16%(+0.720)#28 | 0.19%(+0.698)#1,759 |
| 29. | North Shore | 0.86% | 0.16%(+0.692)#29 | 0.19%(+0.670)#1,805 |
| 30. | South Boston | 0.82% | 0.16%(+0.658)#30 | 0.19%(+0.636)#1,861 |
| 31. | Dendron | 0.78% | 0.16%(+0.616)#31 | 0.19%(+0.594)#1,937 |
| 32. | Remington | 0.77% | 0.16%(+0.602)#32 | 0.19%(+0.580)#1,959 |
| 33. | Springville | 0.74% | 0.16%(+0.580)#33 | 0.19%(+0.558)#2,021 |
| 34. | Falmouth | 0.68% | 0.16%(+0.519)#34 | 0.19%(+0.497)#2,165 |
| 35. | Pulaski | 0.68% | 0.16%(+0.514)#35 | 0.19%(+0.492)#2,178 |
| 36. | Mount Crawford | 0.66% | 0.16%(+0.493)#36 | 0.19%(+0.471)#2,235 |
| 37. | Lake Of The Woods | 0.64% | 0.16%(+0.477)#37 | 0.19%(+0.455)#2,271 |
| 38. | Strasburg | 0.61% | 0.16%(+0.445)#38 | 0.19%(+0.423)#2,373 |
| 39. | New Baltimore | 0.59% | 0.16%(+0.424)#39 | 0.19%(+0.402)#2,426 |
| 40. | Difficult Run | 0.58% | 0.16%(+0.410)#40 | 0.19%(+0.388)#2,467 |
| 41. | Bluefield | 0.57% | 0.16%(+0.405)#41 | 0.19%(+0.383)#2,479 |
| 42. | Wolf Trap | 0.55% | 0.16%(+0.387)#42 | 0.19%(+0.365)#2,544 |
| 43. | Bailey S Crossroads | 0.52% | 0.16%(+0.354)#43 | 0.19%(+0.332)#2,684 |
| 44. | Lakeside | 0.51% | 0.16%(+0.349)#44 | 0.19%(+0.327)#2,703 |
| 45. | West Falls Church | 0.51% | 0.16%(+0.343)#45 | 0.19%(+0.321)#2,722 |
| 46. | Toms Brook | 0.51% | 0.16%(+0.343)#46 | 0.19%(+0.321)#2,726 |
| 47. | Mount Jackson | 0.50% | 0.16%(+0.339)#47 | 0.19%(+0.317)#2,740 |
| 48. | Pantops | 0.49% | 0.16%(+0.329)#48 | 0.19%(+0.307)#2,781 |
| 49. | Fishersville | 0.49% | 0.16%(+0.325)#49 | 0.19%(+0.303)#2,803 |
| 50. | King George | 0.45% | 0.16%(+0.289)#50 | 0.19%(+0.267)#2,964 |
| 51. | Hybla Valley | 0.41% | 0.16%(+0.250)#51 | 0.19%(+0.228)#3,117 |
| 52. | Timberville | 0.41% | 0.16%(+0.244)#52 | 0.19%(+0.222)#3,145 |
| 53. | Broadlands | 0.41% | 0.16%(+0.244)#53 | 0.19%(+0.222)#3,151 |
| 54. | Fair Oaks | 0.39% | 0.16%(+0.228)#54 | 0.19%(+0.206)#3,219 |
| 55. | Fair Lakes | 0.39% | 0.16%(+0.223)#55 | 0.19%(+0.201)#3,244 |
| 56. | Bensley | 0.37% | 0.16%(+0.208)#56 | 0.19%(+0.187)#3,324 |
| 57. | Lowes Island | 0.37% | 0.16%(+0.204)#57 | 0.19%(+0.182)#3,348 |
| 58. | Moorefield | 0.36% | 0.16%(+0.200)#58 | 0.19%(+0.178)#3,370 |
| 59. | Brambleton | 0.36% | 0.16%(+0.197)#59 | 0.19%(+0.175)#3,383 |
| 60. | Burke Centre | 0.36% | 0.16%(+0.195)#60 | 0.19%(+0.173)#3,398 |
| 61. | Centreville | 0.34% | 0.16%(+0.173)#61 | 0.19%(+0.151)#3,515 |
| 62. | Countryside | 0.33% | 0.16%(+0.163)#62 | 0.19%(+0.141)#3,562 |
| 63. | Belle Haven | 0.33% | 0.16%(+0.161)#63 | 0.19%(+0.139)#3,580 |
| 64. | Staunton | 0.32% | 0.16%(+0.159)#64 | 0.19%(+0.137)#3,592 |
| 65. | Union Mill | 0.32% | 0.16%(+0.155)#65 | 0.19%(+0.133)#3,620 |
| 66. | George Mason | 0.32% | 0.16%(+0.150)#66 | 0.19%(+0.129)#3,647 |
| 67. | Wytheville | 0.30% | 0.16%(+0.140)#67 | 0.19%(+0.118)#3,710 |
| 68. | Lake Wilderness | 0.29% | 0.16%(+0.129)#68 | 0.19%(+0.107)#3,773 |
| 69. | Abingdon | 0.29% | 0.16%(+0.126)#69 | 0.19%(+0.104)#3,787 |
| 70. | Dulles Town Center | 0.28% | 0.16%(+0.110)#70 | 0.19%(+0.088)#3,888 |
| 71. | East Highland Park | 0.27% | 0.16%(+0.108)#71 | 0.19%(+0.086)#3,908 |
| 72. | Manassas | 0.27% | 0.16%(+0.105)#72 | 0.19%(+0.083)#3,925 |
| 73. | Mclean | 0.27% | 0.16%(+0.104)#73 | 0.19%(+0.082)#3,929 |
| 74. | Sterling | 0.26% | 0.16%(+0.099)#74 | 0.19%(+0.077)#3,952 |
| 75. | Lake Barcroft | 0.26% | 0.16%(+0.099)#75 | 0.19%(+0.077)#3,955 |
| 76. | Bristol | 0.26% | 0.16%(+0.096)#76 | 0.19%(+0.074)#3,977 |
| 77. | Charlottesville | 0.26% | 0.16%(+0.093)#77 | 0.19%(+0.071)#3,998 |
| 78. | Chesapeake | 0.26% | 0.16%(+0.091)#78 | 0.19%(+0.069)#4,019 |
| 79. | Lincolnia | 0.25% | 0.16%(+0.088)#79 | 0.19%(+0.066)#4,035 |
| 80. | Annandale | 0.25% | 0.16%(+0.087)#80 | 0.19%(+0.065)#4,042 |
| 81. | Crosspointe | 0.24% | 0.16%(+0.079)#81 | 0.19%(+0.057)#4,105 |
| 82. | Idylwood | 0.23% | 0.16%(+0.070)#82 | 0.19%(+0.048)#4,180 |
| 83. | Buckhall | 0.23% | 0.16%(+0.068)#83 | 0.19%(+0.046)#4,192 |
| 84. | South Riding | 0.23% | 0.16%(+0.067)#84 | 0.19%(+0.045)#4,199 |
| 85. | Hopewell | 0.22% | 0.16%(+0.058)#85 | 0.19%(+0.036)#4,260 |
| 86. | Luray | 0.22% | 0.16%(+0.058)#86 | 0.19%(+0.036)#4,262 |
| 87. | Herndon | 0.22% | 0.16%(+0.056)#87 | 0.19%(+0.034)#4,274 |
| 88. | Lexington | 0.22% | 0.16%(+0.056)#88 | 0.19%(+0.034)#4,275 |
| 89. | Mechanicsville | 0.22% | 0.16%(+0.051)#89 | 0.19%(+0.029)#4,311 |
| 90. | Reston | 0.22% | 0.16%(+0.051)#90 | 0.19%(+0.029)#4,322 |
| 91. | Richmond | 0.22% | 0.16%(+0.051)#91 | 0.19%(+0.029)#4,323 |
| 92. | Lansdowne | 0.22% | 0.16%(+0.051)#92 | 0.19%(+0.029)#4,325 |
| 93. | Aquia Harbour | 0.21% | 0.16%(+0.048)#93 | 0.19%(+0.026)#4,345 |
| 94. | Oakton | 0.20% | 0.16%(+0.037)#94 | 0.19%(+0.015)#4,437 |
| 95. | Burke | 0.20% | 0.16%(+0.037)#95 | 0.19%(+0.015)#4,440 |
| 96. | Rose Hill Cdp Fairfax County | 0.19% | 0.16%(+0.024)#96 | 0.19%(+0.002)#4,549 |
| 97. | Tuckahoe | 0.18% | 0.16%(+0.020)#97 | 0.19%(-0.002)#4,590 |
| 98. | Harrisonburg | 0.18% | 0.16%(+0.013)#98 | 0.19%(-0.009)#4,658 |
| 99. | Woodbridge | 0.18% | 0.16%(+0.013)#99 | 0.19%(-0.009)#4,666 |
| 100. | Cave Spring | 0.18% | 0.16%(+0.012)#100 | 0.19%(-0.010)#4,675 |
Common Questions
What are the Top 10 Cities with the Highest Percentage of Unpaid Family Workers in Virginia?
Top 10 Cities with the Highest Percentage of Unpaid Family Workers in Virginia are:
#1
8.6%
#2
4.3%
#3
4.2%
#4
3.0%
#5
2.3%
#6
2.1%
#7
2.1%
#8
1.8%
#9
1.8%
#10
1.7%
What city has the Highest Percentage of Unpaid Family Workers in Virginia?
Tangier has the Highest Percentage of Unpaid Family Workers in Virginia with 8.6%.
What is the Percentage of Unpaid Family Workers in the State of Virginia?
Percentage of Unpaid Family Workers in Virginia is 0.16%.
What is the Percentage of Unpaid Family Workers in the United States?
Percentage of Unpaid Family Workers in the United States is 0.19%.