Cities with the Highest Percentage of Unpaid Family Workers in South Dakota
RELATED REPORTS & OPTIONS
Unpaid Family Workers
South Dakota
Compare Cities
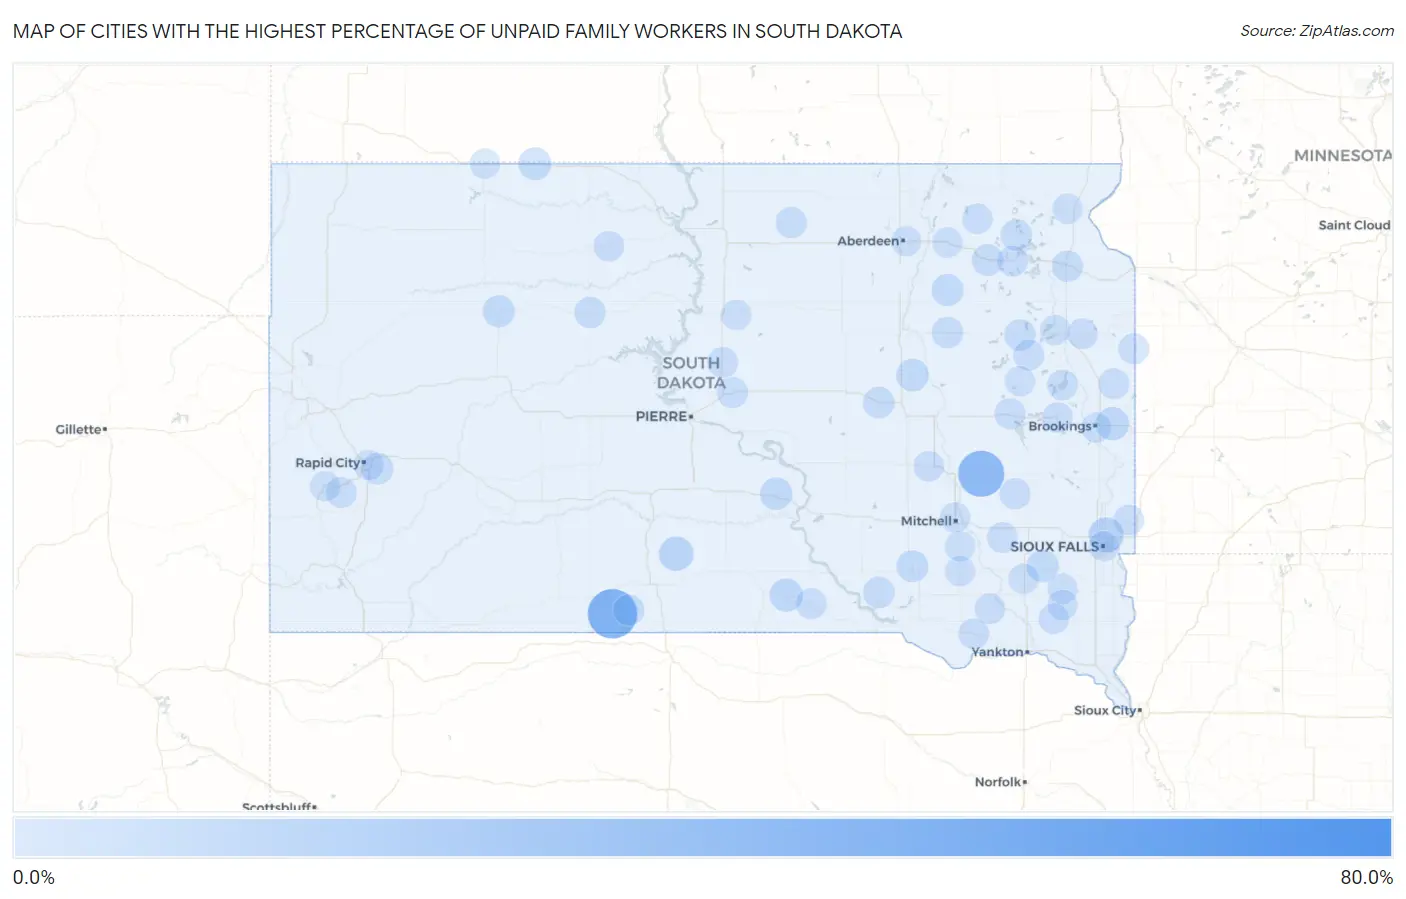
Map of Cities with the Highest Percentage of Unpaid Family Workers in South Dakota
0.0%
80.0%
Cities with the Highest Percentage of Unpaid Family Workers in South Dakota
| City | % Unpaid Family Workers | vs State | vs National | |
| 1. | Clark Colony | 77.8% | 0.25%(+77.5)#1 | 0.19%(+77.6)#4 |
| 2. | Spring Creek | 44.1% | 0.25%(+43.9)#2 | 0.19%(+43.9)#11 |
| 3. | Fedora | 36.4% | 0.25%(+36.1)#3 | 0.19%(+36.2)#17 |
| 4. | Grassland Colony | 33.3% | 0.25%(+33.1)#4 | 0.19%(+33.1)#19 |
| 5. | Glendale Colony | 26.3% | 0.25%(+26.0)#5 | 0.19%(+26.1)#27 |
| 6. | Meadow View Addition | 10.9% | 0.25%(+10.6)#6 | 0.19%(+10.7)#90 |
| 7. | Wood | 9.5% | 0.25%(+9.28)#7 | 0.19%(+9.34)#108 |
| 8. | Bushnell | 6.7% | 0.25%(+6.42)#8 | 0.19%(+6.48)#177 |
| 9. | Dallas | 6.6% | 0.25%(+6.31)#9 | 0.19%(+6.37)#178 |
| 10. | Hitchcock | 5.6% | 0.25%(+5.31)#10 | 0.19%(+5.37)#212 |
| 11. | Morristown | 5.4% | 0.25%(+5.16)#11 | 0.19%(+5.22)#218 |
| 12. | Reliance | 5.0% | 0.25%(+4.75)#12 | 0.19%(+4.81)#247 |
| 13. | Marion | 4.3% | 0.25%(+4.10)#13 | 0.19%(+4.16)#294 |
| 14. | Faith | 4.0% | 0.25%(+3.75)#14 | 0.19%(+3.81)#327 |
| 15. | Conde | 4.0% | 0.25%(+3.75)#15 | 0.19%(+3.81)#328 |
| 16. | Corsica | 3.4% | 0.25%(+3.14)#16 | 0.19%(+3.20)#403 |
| 17. | Green Valley | 3.2% | 0.25%(+2.94)#17 | 0.19%(+3.00)#427 |
| 18. | Henry | 3.1% | 0.25%(+2.88)#18 | 0.19%(+2.94)#437 |
| 19. | Bristol | 3.0% | 0.25%(+2.76)#19 | 0.19%(+2.82)#448 |
| 20. | Geddes | 2.8% | 0.25%(+2.57)#20 | 0.19%(+2.63)#499 |
| 21. | Roslyn | 2.8% | 0.25%(+2.53)#21 | 0.19%(+2.59)#512 |
| 22. | Wessington | 2.8% | 0.25%(+2.50)#22 | 0.19%(+2.57)#519 |
| 23. | Doland | 2.7% | 0.25%(+2.42)#23 | 0.19%(+2.48)#541 |
| 24. | Summit | 2.5% | 0.25%(+2.24)#24 | 0.19%(+2.30)#588 |
| 25. | North Eagle Butte | 2.2% | 0.25%(+1.94)#25 | 0.19%(+2.00)#685 |
| 26. | Hosmer | 2.2% | 0.25%(+1.90)#26 | 0.19%(+1.96)#704 |
| 27. | St Francis | 2.0% | 0.25%(+1.76)#27 | 0.19%(+1.82)#766 |
| 28. | Keystone | 1.9% | 0.25%(+1.61)#28 | 0.19%(+1.67)#831 |
| 29. | Canova | 1.8% | 0.25%(+1.54)#29 | 0.19%(+1.60)#866 |
| 30. | De Smet | 1.8% | 0.25%(+1.52)#30 | 0.19%(+1.58)#876 |
| 31. | Blunt | 1.7% | 0.25%(+1.46)#31 | 0.19%(+1.52)#902 |
| 32. | Hazel | 1.6% | 0.25%(+1.34)#32 | 0.19%(+1.40)#985 |
| 33. | Toronto | 1.5% | 0.25%(+1.21)#33 | 0.19%(+1.27)#1,065 |
| 34. | Onida | 1.2% | 0.25%(+0.976)#34 | 0.19%(+1.04)#1,303 |
| 35. | Webster | 1.2% | 0.25%(+0.914)#35 | 0.19%(+0.975)#1,369 |
| 36. | Lake Poinsett | 1.1% | 0.25%(+0.889)#36 | 0.19%(+0.949)#1,396 |
| 37. | Burke | 1.1% | 0.25%(+0.876)#37 | 0.19%(+0.937)#1,408 |
| 38. | Gary | 1.1% | 0.25%(+0.864)#38 | 0.19%(+0.924)#1,423 |
| 39. | Emery | 1.1% | 0.25%(+0.844)#39 | 0.19%(+0.904)#1,444 |
| 40. | Woonsocket | 0.96% | 0.25%(+0.714)#40 | 0.19%(+0.775)#1,629 |
| 41. | Arlington | 0.94% | 0.25%(+0.692)#41 | 0.19%(+0.752)#1,666 |
| 42. | Scotland | 0.93% | 0.25%(+0.679)#42 | 0.19%(+0.739)#1,690 |
| 43. | Tyndall | 0.92% | 0.25%(+0.676)#43 | 0.19%(+0.737)#1,693 |
| 44. | Garretson | 0.83% | 0.25%(+0.582)#44 | 0.19%(+0.642)#1,848 |
| 45. | Kranzburg | 0.81% | 0.25%(+0.559)#45 | 0.19%(+0.620)#1,889 |
| 46. | Irene | 0.75% | 0.25%(+0.502)#46 | 0.19%(+0.562)#2,010 |
| 47. | Timber Lake | 0.72% | 0.25%(+0.469)#47 | 0.19%(+0.530)#2,093 |
| 48. | Langford | 0.71% | 0.25%(+0.464)#48 | 0.19%(+0.525)#2,109 |
| 49. | Ethan | 0.62% | 0.25%(+0.370)#49 | 0.19%(+0.430)#2,348 |
| 50. | Groton | 0.57% | 0.25%(+0.319)#50 | 0.19%(+0.379)#2,490 |
| 51. | Hurley | 0.56% | 0.25%(+0.311)#51 | 0.19%(+0.372)#2,519 |
| 52. | Hill City | 0.55% | 0.25%(+0.307)#52 | 0.19%(+0.367)#2,535 |
| 53. | Gettysburg | 0.55% | 0.25%(+0.306)#53 | 0.19%(+0.366)#2,539 |
| 54. | Viborg | 0.55% | 0.25%(+0.301)#54 | 0.19%(+0.361)#2,564 |
| 55. | Freeman | 0.45% | 0.25%(+0.198)#55 | 0.19%(+0.259)#3,001 |
| 56. | Bryant | 0.39% | 0.25%(+0.140)#56 | 0.19%(+0.201)#3,250 |
| 57. | Lemmon | 0.36% | 0.25%(+0.115)#57 | 0.19%(+0.175)#3,381 |
| 58. | Sisseton | 0.31% | 0.25%(+0.058)#58 | 0.19%(+0.119)#3,704 |
| 59. | Parkston | 0.30% | 0.25%(+0.052)#59 | 0.19%(+0.113)#3,742 |
| 60. | Aberdeen | 0.28% | 0.25%(+0.032)#60 | 0.19%(+0.093)#3,849 |
| 61. | Mitchell | 0.22% | 0.25%(-0.027)#61 | 0.19%(+0.034)#4,273 |
| 62. | Watertown | 0.15% | 0.25%(-0.099)#62 | 0.19%(-0.038)#4,964 |
| 63. | Brookings | 0.12% | 0.25%(-0.131)#63 | 0.19%(-0.070)#5,312 |
| 64. | Sioux Falls | 0.072% | 0.25%(-0.176)#64 | 0.19%(-0.115)#5,706 |
| 65. | Rapid City | 0.024% | 0.25%(-0.223)#65 | 0.19%(-0.163)#6,009 |
Common Questions
What are the Top 10 Cities with the Highest Percentage of Unpaid Family Workers in South Dakota?
Top 10 Cities with the Highest Percentage of Unpaid Family Workers in South Dakota are:
#1
44.1%
#2
36.4%
#3
10.9%
#4
9.5%
#5
6.7%
#6
6.6%
#7
5.6%
#8
5.4%
#9
5.0%
#10
4.3%
What city has the Highest Percentage of Unpaid Family Workers in South Dakota?
Spring Creek has the Highest Percentage of Unpaid Family Workers in South Dakota with 44.1%.
What is the Percentage of Unpaid Family Workers in the State of South Dakota?
Percentage of Unpaid Family Workers in South Dakota is 0.25%.
What is the Percentage of Unpaid Family Workers in the United States?
Percentage of Unpaid Family Workers in the United States is 0.19%.