Cities with the Highest Percentage of Unpaid Family Workers in Ohio
RELATED REPORTS & OPTIONS
Unpaid Family Workers
Ohio
Compare Cities
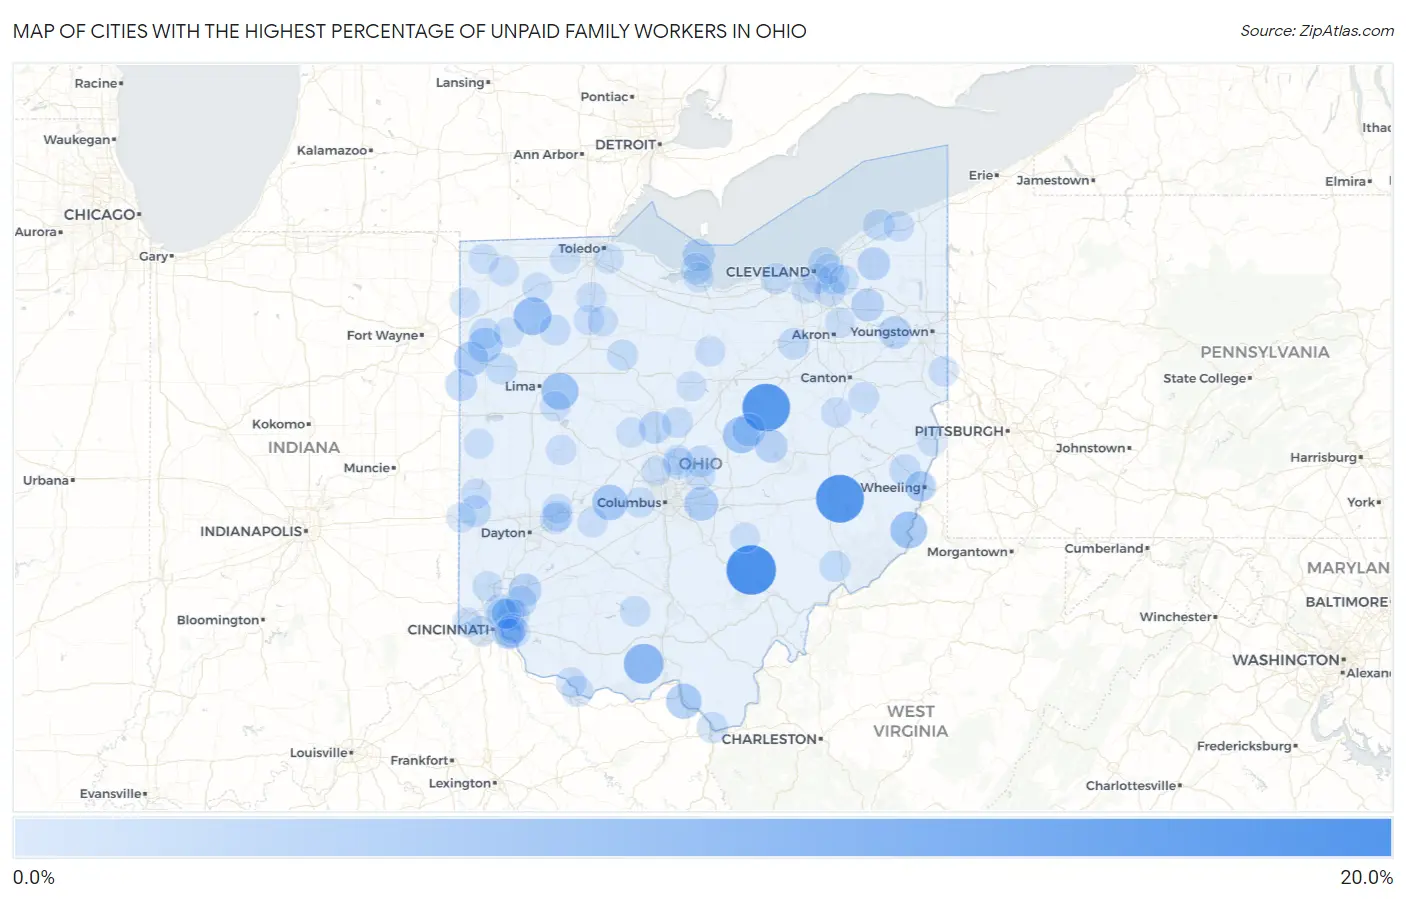
Map of Cities with the Highest Percentage of Unpaid Family Workers in Ohio
0.0%
20.0%
Cities with the Highest Percentage of Unpaid Family Workers in Ohio
| City | % Unpaid Family Workers | vs State | vs National | |
| 1. | Carbon Hill | 15.9% | 0.16%(+15.8)#1 | 0.19%(+15.8)#57 |
| 2. | Lore City | 14.6% | 0.16%(+14.4)#2 | 0.19%(+14.4)#60 |
| 3. | Nashville | 14.4% | 0.16%(+14.3)#3 | 0.19%(+14.2)#62 |
| 4. | Otway | 8.0% | 0.16%(+7.84)#4 | 0.19%(+7.81)#135 |
| 5. | New Bavaria | 6.5% | 0.16%(+6.29)#5 | 0.19%(+6.26)#183 |
| 6. | Clarington | 5.8% | 0.16%(+5.62)#6 | 0.19%(+5.60)#204 |
| 7. | Harrod | 5.7% | 0.16%(+5.52)#7 | 0.19%(+5.49)#205 |
| 8. | Howard | 5.4% | 0.16%(+5.23)#8 | 0.19%(+5.21)#220 |
| 9. | Choctaw Lake | 4.6% | 0.16%(+4.43)#9 | 0.19%(+4.41)#270 |
| 10. | Franklin Furnace | 4.5% | 0.16%(+4.32)#10 | 0.19%(+4.30)#285 |
| 11. | South Mount Vernon | 4.1% | 0.16%(+3.98)#11 | 0.19%(+3.95)#319 |
| 12. | Haviland | 3.7% | 0.16%(+3.59)#12 | 0.19%(+3.56)#357 |
| 13. | Convoy | 3.7% | 0.16%(+3.54)#13 | 0.19%(+3.51)#365 |
| 14. | Etna | 3.5% | 0.16%(+3.36)#14 | 0.19%(+3.33)#383 |
| 15. | Danville | 2.8% | 0.16%(+2.61)#15 | 0.19%(+2.58)#515 |
| 16. | Nellie | 2.7% | 0.16%(+2.51)#16 | 0.19%(+2.48)#540 |
| 17. | Aquilla | 2.6% | 0.16%(+2.45)#17 | 0.19%(+2.42)#553 |
| 18. | Lake Milton | 2.6% | 0.16%(+2.40)#18 | 0.19%(+2.38)#561 |
| 19. | Mantua | 2.5% | 0.16%(+2.38)#19 | 0.19%(+2.35)#569 |
| 20. | South Lebanon | 2.5% | 0.16%(+2.38)#20 | 0.19%(+2.35)#571 |
| 21. | Saybrook-On-The-Lake | 2.5% | 0.16%(+2.33)#21 | 0.19%(+2.30)#585 |
| 22. | Kelleys Island | 2.4% | 0.16%(+2.25)#22 | 0.19%(+2.22)#612 |
| 23. | Kenwood | 2.3% | 0.16%(+2.16)#23 | 0.19%(+2.13)#642 |
| 24. | Waldo | 2.2% | 0.16%(+2.06)#24 | 0.19%(+2.04)#673 |
| 25. | Willshire | 2.0% | 0.16%(+1.84)#25 | 0.19%(+1.81)#772 |
| 26. | Eldorado | 1.8% | 0.16%(+1.69)#26 | 0.19%(+1.66)#836 |
| 27. | Hartford Croton | 1.7% | 0.16%(+1.58)#27 | 0.19%(+1.56)#886 |
| 28. | The Village Of Indian Hill | 1.7% | 0.16%(+1.56)#28 | 0.19%(+1.53)#900 |
| 29. | Marblehead | 1.6% | 0.16%(+1.48)#29 | 0.19%(+1.46)#938 |
| 30. | Highland Hills | 1.6% | 0.16%(+1.44)#30 | 0.19%(+1.42)#970 |
| 31. | Middle Point | 1.6% | 0.16%(+1.44)#31 | 0.19%(+1.41)#975 |
| 32. | Seville | 1.6% | 0.16%(+1.42)#32 | 0.19%(+1.39)#990 |
| 33. | Lockland | 1.6% | 0.16%(+1.41)#33 | 0.19%(+1.38)#991 |
| 34. | Harrisville | 1.5% | 0.16%(+1.35)#34 | 0.19%(+1.33)#1,034 |
| 35. | North Perry | 1.4% | 0.16%(+1.27)#35 | 0.19%(+1.24)#1,090 |
| 36. | Amberley | 1.4% | 0.16%(+1.26)#36 | 0.19%(+1.23)#1,102 |
| 37. | Loveland Park | 1.4% | 0.16%(+1.25)#37 | 0.19%(+1.23)#1,112 |
| 38. | Latty | 1.4% | 0.16%(+1.25)#38 | 0.19%(+1.22)#1,121 |
| 39. | Lowell | 1.4% | 0.16%(+1.24)#39 | 0.19%(+1.21)#1,129 |
| 40. | Galena | 1.4% | 0.16%(+1.22)#40 | 0.19%(+1.19)#1,154 |
| 41. | South Point | 1.4% | 0.16%(+1.21)#41 | 0.19%(+1.18)#1,160 |
| 42. | Avon | 1.3% | 0.16%(+1.18)#42 | 0.19%(+1.15)#1,182 |
| 43. | Bratenahl | 1.3% | 0.16%(+1.14)#43 | 0.19%(+1.11)#1,220 |
| 44. | Carey | 1.2% | 0.16%(+1.07)#44 | 0.19%(+1.04)#1,295 |
| 45. | Roseland | 1.1% | 0.16%(+0.987)#45 | 0.19%(+0.961)#1,380 |
| 46. | Delhi Hills | 1.1% | 0.16%(+0.953)#46 | 0.19%(+0.927)#1,418 |
| 47. | Waynesburg | 1.1% | 0.16%(+0.929)#47 | 0.19%(+0.902)#1,445 |
| 48. | Cardington | 1.1% | 0.16%(+0.924)#48 | 0.19%(+0.898)#1,451 |
| 49. | Aberdeen | 1.1% | 0.16%(+0.917)#49 | 0.19%(+0.891)#1,455 |
| 50. | Bridgeport | 1.1% | 0.16%(+0.908)#50 | 0.19%(+0.882)#1,465 |
| 51. | Holiday Valley | 1.1% | 0.16%(+0.892)#51 | 0.19%(+0.866)#1,491 |
| 52. | Walton Hills | 1.0% | 0.16%(+0.862)#52 | 0.19%(+0.835)#1,530 |
| 53. | Geneva | 1.0% | 0.16%(+0.861)#53 | 0.19%(+0.834)#1,532 |
| 54. | Leipsic | 1.0% | 0.16%(+0.854)#54 | 0.19%(+0.828)#1,538 |
| 55. | Lake Darby | 0.98% | 0.16%(+0.821)#55 | 0.19%(+0.794)#1,599 |
| 56. | Green Meadows | 0.94% | 0.16%(+0.775)#56 | 0.19%(+0.749)#1,672 |
| 57. | Bainbridge | 0.91% | 0.16%(+0.753)#57 | 0.19%(+0.726)#1,710 |
| 58. | Portage | 0.90% | 0.16%(+0.740)#58 | 0.19%(+0.714)#1,736 |
| 59. | Newburgh Heights | 0.87% | 0.16%(+0.705)#59 | 0.19%(+0.679)#1,789 |
| 60. | Cherry Grove | 0.83% | 0.16%(+0.667)#60 | 0.19%(+0.641)#1,850 |
| 61. | East Palestine | 0.82% | 0.16%(+0.664)#61 | 0.19%(+0.638)#1,854 |
| 62. | Sherwood | 0.82% | 0.16%(+0.663)#62 | 0.19%(+0.636)#1,858 |
| 63. | Shiloh | 0.82% | 0.16%(+0.656)#63 | 0.19%(+0.629)#1,874 |
| 64. | North Baltimore | 0.80% | 0.16%(+0.639)#64 | 0.19%(+0.613)#1,904 |
| 65. | Ripley | 0.79% | 0.16%(+0.633)#65 | 0.19%(+0.607)#1,914 |
| 66. | Salem Heights | 0.77% | 0.16%(+0.608)#66 | 0.19%(+0.581)#1,957 |
| 67. | Wayne Lakes | 0.76% | 0.16%(+0.599)#67 | 0.19%(+0.573)#1,982 |
| 68. | Parral | 0.76% | 0.16%(+0.597)#68 | 0.19%(+0.571)#1,988 |
| 69. | De Graff | 0.74% | 0.16%(+0.584)#69 | 0.19%(+0.558)#2,022 |
| 70. | Fruit Hill | 0.74% | 0.16%(+0.579)#70 | 0.19%(+0.553)#2,032 |
| 71. | Johnstown | 0.70% | 0.16%(+0.538)#71 | 0.19%(+0.512)#2,135 |
| 72. | Parma Heights | 0.70% | 0.16%(+0.535)#72 | 0.19%(+0.508)#2,143 |
| 73. | North Bend | 0.68% | 0.16%(+0.523)#73 | 0.19%(+0.496)#2,166 |
| 74. | Bloomdale | 0.68% | 0.16%(+0.517)#74 | 0.19%(+0.491)#2,184 |
| 75. | Montpelier | 0.68% | 0.16%(+0.517)#75 | 0.19%(+0.491)#2,186 |
| 76. | Waynesfield | 0.66% | 0.16%(+0.499)#76 | 0.19%(+0.473)#2,229 |
| 77. | Hamilton | 0.65% | 0.16%(+0.492)#77 | 0.19%(+0.466)#2,245 |
| 78. | Sandusky | 0.64% | 0.16%(+0.477)#78 | 0.19%(+0.450)#2,284 |
| 79. | Steubenville | 0.63% | 0.16%(+0.469)#79 | 0.19%(+0.443)#2,313 |
| 80. | Donnelsville | 0.62% | 0.16%(+0.461)#80 | 0.19%(+0.434)#2,335 |
| 81. | Burkettsville | 0.62% | 0.16%(+0.457)#81 | 0.19%(+0.430)#2,347 |
| 82. | Sunbury | 0.62% | 0.16%(+0.456)#82 | 0.19%(+0.429)#2,350 |
| 83. | Dry Run | 0.60% | 0.16%(+0.444)#83 | 0.19%(+0.418)#2,387 |
| 84. | Napoleon | 0.60% | 0.16%(+0.443)#84 | 0.19%(+0.417)#2,391 |
| 85. | Cleveland Heights | 0.60% | 0.16%(+0.441)#85 | 0.19%(+0.415)#2,398 |
| 86. | Moreland Hills | 0.60% | 0.16%(+0.439)#86 | 0.19%(+0.412)#2,404 |
| 87. | South Charleston | 0.59% | 0.16%(+0.428)#87 | 0.19%(+0.401)#2,429 |
| 88. | Silver Lake | 0.56% | 0.16%(+0.401)#88 | 0.19%(+0.374)#2,507 |
| 89. | Walbridge | 0.56% | 0.16%(+0.399)#89 | 0.19%(+0.373)#2,513 |
| 90. | Richwood | 0.56% | 0.16%(+0.398)#90 | 0.19%(+0.372)#2,516 |
| 91. | Junction City | 0.56% | 0.16%(+0.395)#91 | 0.19%(+0.369)#2,530 |
| 92. | New Paris | 0.55% | 0.16%(+0.389)#92 | 0.19%(+0.363)#2,558 |
| 93. | Galion | 0.54% | 0.16%(+0.384)#93 | 0.19%(+0.358)#2,580 |
| 94. | Deer Park | 0.54% | 0.16%(+0.383)#94 | 0.19%(+0.356)#2,589 |
| 95. | Oakwood | 0.54% | 0.16%(+0.377)#95 | 0.19%(+0.351)#2,603 |
| 96. | Hicksville | 0.54% | 0.16%(+0.377)#96 | 0.19%(+0.350)#2,606 |
| 97. | Swanton | 0.54% | 0.16%(+0.375)#97 | 0.19%(+0.349)#2,616 |
| 98. | Stryker | 0.53% | 0.16%(+0.370)#98 | 0.19%(+0.344)#2,637 |
| 99. | Brookside | 0.53% | 0.16%(+0.366)#99 | 0.19%(+0.339)#2,652 |
| 100. | Powell | 0.52% | 0.16%(+0.362)#100 | 0.19%(+0.336)#2,668 |
Common Questions
What are the Top 10 Cities with the Highest Percentage of Unpaid Family Workers in Ohio?
Top 10 Cities with the Highest Percentage of Unpaid Family Workers in Ohio are:
#1
15.9%
#2
14.6%
#3
14.4%
#4
8.0%
#5
6.5%
#6
5.8%
#7
5.7%
#8
5.4%
#9
4.6%
#10
4.5%
What city has the Highest Percentage of Unpaid Family Workers in Ohio?
Carbon Hill has the Highest Percentage of Unpaid Family Workers in Ohio with 15.9%.
What is the Percentage of Unpaid Family Workers in the State of Ohio?
Percentage of Unpaid Family Workers in Ohio is 0.16%.
What is the Percentage of Unpaid Family Workers in the United States?
Percentage of Unpaid Family Workers in the United States is 0.19%.