Zip Codes with the Highest Percentage of Population Employed in Arts, Entertainment & Recreation in Woodinville, WA
RELATED REPORTS & OPTIONS
Arts, Entertainment & Recreation
Woodinville
Compare Zip Codes
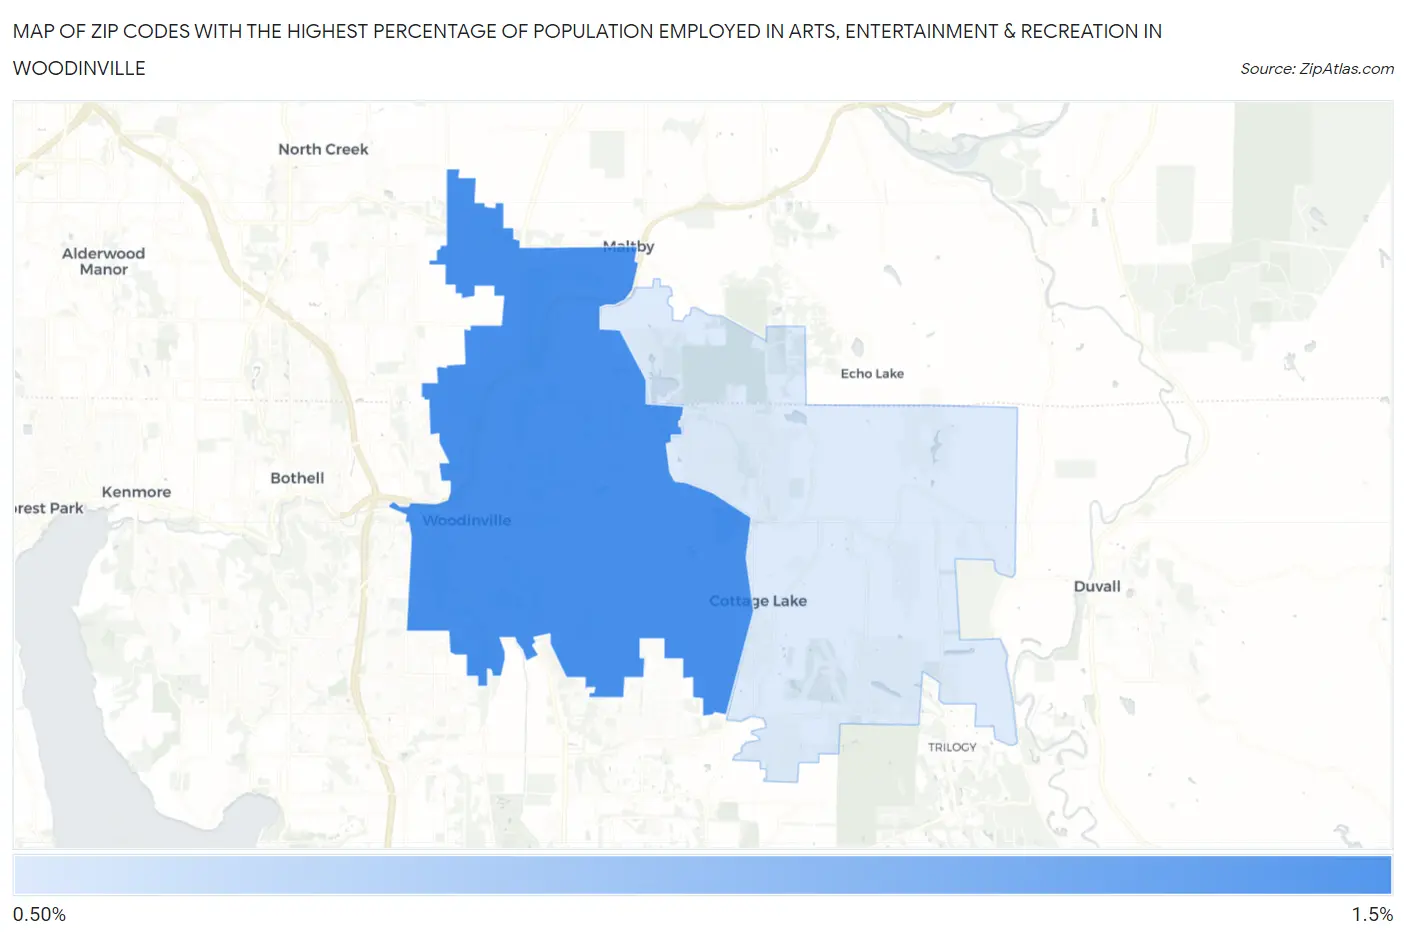
Map of Zip Codes with the Highest Percentage of Population Employed in Arts, Entertainment & Recreation in Woodinville
1.2%
1.4%
Zip Codes with the Highest Percentage of Population Employed in Arts, Entertainment & Recreation in Woodinville, WA
| Zip Code | % Employed | vs State | vs National | |
| 1. | 98072 | 1.4% | 2.1%(-0.699)#317 | 2.1%(-0.636)#13,624 |
| 2. | 98077 | 1.2% | 2.1%(-0.926)#350 | 2.1%(-0.862)#15,317 |
1
Common Questions
What are the Top Zip Codes with the Highest Percentage of Population Employed in Arts, Entertainment & Recreation in Woodinville, WA?
Top Zip Codes with the Highest Percentage of Population Employed in Arts, Entertainment & Recreation in Woodinville, WA are:
What zip code has the Highest Percentage of Population Employed in Arts, Entertainment & Recreation in Woodinville, WA?
98072 has the Highest Percentage of Population Employed in Arts, Entertainment & Recreation in Woodinville, WA with 1.4%.
What is the Percentage of Population Employed in Arts, Entertainment & Recreation in Woodinville, WA?
Percentage of Population Employed in Arts, Entertainment & Recreation in Woodinville is 0.89%.
What is the Percentage of Population Employed in Arts, Entertainment & Recreation in Washington?
Percentage of Population Employed in Arts, Entertainment & Recreation in Washington is 2.1%.
What is the Percentage of Population Employed in Arts, Entertainment & Recreation in the United States?
Percentage of Population Employed in Arts, Entertainment & Recreation in the United States is 2.1%.