Cities with the Highest Percentage of Population Employed in Arts, Entertainment & Recreation in Massachusetts
RELATED REPORTS & OPTIONS
Arts, Entertainment & Recreation
Massachusetts
Compare Cities
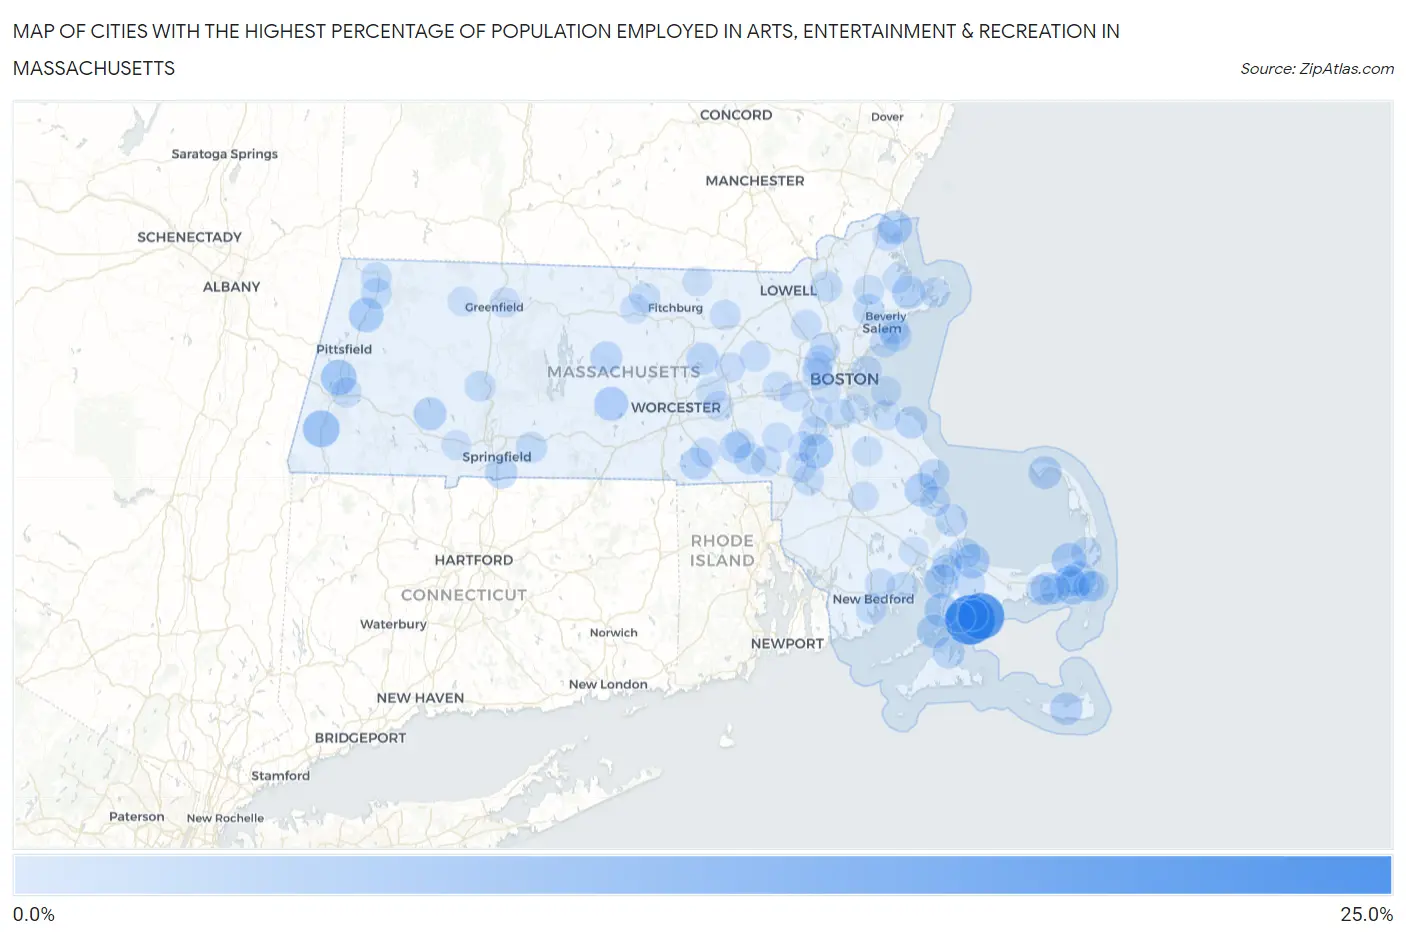
Map of Cities with the Highest Percentage of Population Employed in Arts, Entertainment & Recreation in Massachusetts
0.0%
25.0%
Cities with the Highest Percentage of Population Employed in Arts, Entertainment & Recreation in Massachusetts
| City | % Employed | vs State | vs National | |
| 1. | Seconsett Island | 22.2% | 2.0%(+20.2)#1 | 2.1%(+20.1)#225 |
| 2. | Popponesset | 18.8% | 2.0%(+16.9)#2 | 2.1%(+16.8)#292 |
| 3. | Oak Bluffs | 15.6% | 2.0%(+13.6)#3 | 2.1%(+13.5)#432 |
| 4. | Great Barrington | 9.1% | 2.0%(+7.09)#4 | 2.1%(+6.99)#1,060 |
| 5. | Lenox | 7.8% | 2.0%(+5.86)#5 | 2.1%(+5.75)#1,341 |
| 6. | Cheshire | 6.8% | 2.0%(+4.80)#6 | 2.1%(+4.70)#1,661 |
| 7. | Harwich Port | 6.7% | 2.0%(+4.71)#7 | 2.1%(+4.61)#1,688 |
| 8. | East Harwich | 6.7% | 2.0%(+4.67)#8 | 2.1%(+4.57)#1,706 |
| 9. | Sandwich | 6.6% | 2.0%(+4.61)#9 | 2.1%(+4.50)#1,733 |
| 10. | Sharon | 6.5% | 2.0%(+4.51)#10 | 2.1%(+4.40)#1,780 |
| 11. | Brewster | 6.4% | 2.0%(+4.41)#11 | 2.1%(+4.30)#1,823 |
| 12. | Salisbury | 6.4% | 2.0%(+4.40)#12 | 2.1%(+4.30)#1,827 |
| 13. | North Brookfield | 6.2% | 2.0%(+4.20)#13 | 2.1%(+4.09)#1,909 |
| 14. | Pocasset | 6.0% | 2.0%(+4.02)#14 | 2.1%(+3.92)#1,981 |
| 15. | West Falmouth | 5.9% | 2.0%(+3.90)#15 | 2.1%(+3.80)#2,039 |
| 16. | Woods Hole | 5.8% | 2.0%(+3.81)#16 | 2.1%(+3.70)#2,103 |
| 17. | Kingston | 5.8% | 2.0%(+3.80)#17 | 2.1%(+3.70)#2,105 |
| 18. | West Dennis | 5.7% | 2.0%(+3.69)#18 | 2.1%(+3.58)#2,164 |
| 19. | Essex | 5.6% | 2.0%(+3.59)#19 | 2.1%(+3.48)#2,226 |
| 20. | Provincetown | 5.3% | 2.0%(+3.31)#20 | 2.1%(+3.21)#2,386 |
| 21. | Huntington | 5.2% | 2.0%(+3.23)#21 | 2.1%(+3.12)#2,452 |
| 22. | Nantucket | 4.9% | 2.0%(+2.92)#22 | 2.1%(+2.82)#2,680 |
| 23. | Longmeadow | 4.7% | 2.0%(+2.74)#23 | 2.1%(+2.63)#2,823 |
| 24. | Clinton | 4.6% | 2.0%(+2.65)#24 | 2.1%(+2.54)#2,889 |
| 25. | North Scituate | 4.6% | 2.0%(+2.58)#25 | 2.1%(+2.47)#2,967 |
| 26. | The Pinehills | 4.5% | 2.0%(+2.57)#26 | 2.1%(+2.47)#2,969 |
| 27. | East Douglas | 4.5% | 2.0%(+2.51)#27 | 2.1%(+2.41)#3,048 |
| 28. | Barre | 4.3% | 2.0%(+2.31)#28 | 2.1%(+2.21)#3,281 |
| 29. | Vineyard Haven | 4.3% | 2.0%(+2.30)#29 | 2.1%(+2.19)#3,304 |
| 30. | Sagamore | 4.0% | 2.0%(+2.06)#30 | 2.1%(+1.95)#3,592 |
| 31. | Duxbury | 4.0% | 2.0%(+2.03)#31 | 2.1%(+1.93)#3,618 |
| 32. | Bellingham | 4.0% | 2.0%(+2.02)#32 | 2.1%(+1.91)#3,641 |
| 33. | Harwich Center | 3.9% | 2.0%(+1.93)#33 | 2.1%(+1.83)#3,745 |
| 34. | Hopedale | 3.8% | 2.0%(+1.84)#34 | 2.1%(+1.74)#3,872 |
| 35. | Wilbraham | 3.7% | 2.0%(+1.77)#35 | 2.1%(+1.66)#3,989 |
| 36. | Andover | 3.7% | 2.0%(+1.73)#36 | 2.1%(+1.63)#4,040 |
| 37. | Danvers | 3.6% | 2.0%(+1.65)#37 | 2.1%(+1.54)#4,176 |
| 38. | Salem | 3.6% | 2.0%(+1.60)#38 | 2.1%(+1.50)#4,253 |
| 39. | Amherst | 3.6% | 2.0%(+1.59)#39 | 2.1%(+1.48)#4,278 |
| 40. | Seabrook | 3.6% | 2.0%(+1.57)#40 | 2.1%(+1.47)#4,295 |
| 41. | West Chatham | 3.5% | 2.0%(+1.54)#41 | 2.1%(+1.43)#4,364 |
| 42. | Marblehead | 3.5% | 2.0%(+1.49)#42 | 2.1%(+1.38)#4,453 |
| 43. | Adams | 3.4% | 2.0%(+1.47)#43 | 2.1%(+1.36)#4,504 |
| 44. | Mattapoisett Center | 3.4% | 2.0%(+1.41)#44 | 2.1%(+1.31)#4,604 |
| 45. | Northampton | 3.4% | 2.0%(+1.38)#45 | 2.1%(+1.28)#4,658 |
| 46. | Bliss Corner | 3.3% | 2.0%(+1.30)#46 | 2.1%(+1.19)#4,837 |
| 47. | Mansfield Center | 3.2% | 2.0%(+1.23)#47 | 2.1%(+1.13)#4,948 |
| 48. | North Adams | 3.2% | 2.0%(+1.21)#48 | 2.1%(+1.11)#4,985 |
| 49. | Winthrop Town | 3.1% | 2.0%(+1.14)#49 | 2.1%(+1.04)#5,136 |
| 50. | Hingham | 3.1% | 2.0%(+1.14)#50 | 2.1%(+1.03)#5,146 |
| 51. | Dennis Port | 3.1% | 2.0%(+1.12)#51 | 2.1%(+1.02)#5,178 |
| 52. | Chatham | 3.1% | 2.0%(+1.11)#52 | 2.1%(+1.00)#5,209 |
| 53. | Ayer | 3.1% | 2.0%(+1.10)#53 | 2.1%(+0.999)#5,223 |
| 54. | Plymouth | 3.0% | 2.0%(+1.06)#54 | 2.1%(+0.960)#5,311 |
| 55. | Maynard | 3.0% | 2.0%(+1.04)#55 | 2.1%(+0.936)#5,356 |
| 56. | Franklin Town | 3.0% | 2.0%(+1.03)#56 | 2.1%(+0.924)#5,377 |
| 57. | Watertown Town | 3.0% | 2.0%(+1.01)#57 | 2.1%(+0.904)#5,421 |
| 58. | South Yarmouth | 3.0% | 2.0%(+0.989)#58 | 2.1%(+0.885)#5,467 |
| 59. | Pinehurst | 2.9% | 2.0%(+0.951)#59 | 2.1%(+0.847)#5,558 |
| 60. | Wellesley | 2.9% | 2.0%(+0.939)#60 | 2.1%(+0.835)#5,582 |
| 61. | South Ashburnham | 2.9% | 2.0%(+0.938)#61 | 2.1%(+0.833)#5,588 |
| 62. | Forestdale | 2.9% | 2.0%(+0.929)#62 | 2.1%(+0.824)#5,608 |
| 63. | Lee | 2.9% | 2.0%(+0.923)#63 | 2.1%(+0.818)#5,624 |
| 64. | Acushnet Center | 2.9% | 2.0%(+0.898)#64 | 2.1%(+0.793)#5,690 |
| 65. | Orleans | 2.9% | 2.0%(+0.890)#65 | 2.1%(+0.786)#5,714 |
| 66. | Winchester | 2.9% | 2.0%(+0.881)#66 | 2.1%(+0.777)#5,735 |
| 67. | Gloucester | 2.8% | 2.0%(+0.861)#67 | 2.1%(+0.757)#5,799 |
| 68. | Dedham | 2.8% | 2.0%(+0.815)#68 | 2.1%(+0.711)#5,924 |
| 69. | Topsfield | 2.8% | 2.0%(+0.775)#69 | 2.1%(+0.670)#6,029 |
| 70. | Newburyport | 2.7% | 2.0%(+0.741)#70 | 2.1%(+0.636)#6,132 |
| 71. | Foxborough | 2.7% | 2.0%(+0.732)#71 | 2.1%(+0.628)#6,159 |
| 72. | Turners Falls | 2.7% | 2.0%(+0.732)#72 | 2.1%(+0.628)#6,160 |
| 73. | Millis Clicquot | 2.7% | 2.0%(+0.698)#73 | 2.1%(+0.593)#6,262 |
| 74. | East Falmouth | 2.7% | 2.0%(+0.673)#74 | 2.1%(+0.569)#6,334 |
| 75. | Arlington | 2.6% | 2.0%(+0.666)#75 | 2.1%(+0.561)#6,361 |
| 76. | Swampscott | 2.6% | 2.0%(+0.623)#76 | 2.1%(+0.518)#6,479 |
| 77. | Hull | 2.6% | 2.0%(+0.608)#77 | 2.1%(+0.503)#6,523 |
| 78. | Abington | 2.6% | 2.0%(+0.582)#78 | 2.1%(+0.478)#6,606 |
| 79. | Norwood | 2.6% | 2.0%(+0.577)#79 | 2.1%(+0.473)#6,624 |
| 80. | Westborough | 2.5% | 2.0%(+0.566)#80 | 2.1%(+0.461)#6,661 |
| 81. | Bridgewater Town | 2.5% | 2.0%(+0.554)#81 | 2.1%(+0.449)#6,702 |
| 82. | Northborough | 2.5% | 2.0%(+0.543)#82 | 2.1%(+0.438)#6,759 |
| 83. | Buzzards Bay | 2.5% | 2.0%(+0.534)#83 | 2.1%(+0.429)#6,786 |
| 84. | Bourne | 2.5% | 2.0%(+0.530)#84 | 2.1%(+0.425)#6,796 |
| 85. | Hudson | 2.5% | 2.0%(+0.513)#85 | 2.1%(+0.408)#6,856 |
| 86. | Cedar Crest | 2.5% | 2.0%(+0.482)#86 | 2.1%(+0.378)#6,950 |
| 87. | Milton | 2.5% | 2.0%(+0.477)#87 | 2.1%(+0.372)#6,971 |
| 88. | Belmont | 2.5% | 2.0%(+0.474)#88 | 2.1%(+0.369)#6,981 |
| 89. | Ipswich | 2.4% | 2.0%(+0.468)#89 | 2.1%(+0.363)#6,997 |
| 90. | Westfield | 2.4% | 2.0%(+0.466)#90 | 2.1%(+0.361)#7,003 |
| 91. | Townsend | 2.4% | 2.0%(+0.452)#91 | 2.1%(+0.347)#7,067 |
| 92. | Quincy | 2.4% | 2.0%(+0.419)#92 | 2.1%(+0.314)#7,170 |
| 93. | Gardner | 2.4% | 2.0%(+0.391)#93 | 2.1%(+0.286)#7,259 |
| 94. | West Wareham | 2.4% | 2.0%(+0.390)#94 | 2.1%(+0.285)#7,261 |
| 95. | Milford | 2.4% | 2.0%(+0.379)#95 | 2.1%(+0.275)#7,306 |
| 96. | Brookline | 2.4% | 2.0%(+0.377)#96 | 2.1%(+0.272)#7,314 |
| 97. | Shelburne Falls | 2.4% | 2.0%(+0.377)#97 | 2.1%(+0.272)#7,315 |
| 98. | Cochituate | 2.4% | 2.0%(+0.376)#98 | 2.1%(+0.271)#7,317 |
| 99. | Walpole | 2.3% | 2.0%(+0.371)#99 | 2.1%(+0.267)#7,332 |
| 100. | Whitinsville | 2.3% | 2.0%(+0.344)#100 | 2.1%(+0.239)#7,417 |
Common Questions
What are the Top 10 Cities with the Highest Percentage of Population Employed in Arts, Entertainment & Recreation in Massachusetts?
Top 10 Cities with the Highest Percentage of Population Employed in Arts, Entertainment & Recreation in Massachusetts are:
#1
22.2%
#2
18.8%
#3
9.1%
#4
7.8%
#5
6.8%
#6
6.7%
#7
6.7%
#8
6.6%
#9
6.5%
#10
6.4%
What city has the Highest Percentage of Population Employed in Arts, Entertainment & Recreation in Massachusetts?
Seconsett Island has the Highest Percentage of Population Employed in Arts, Entertainment & Recreation in Massachusetts with 22.2%.
What is the Percentage of Population Employed in Arts, Entertainment & Recreation in the State of Massachusetts?
Percentage of Population Employed in Arts, Entertainment & Recreation in Massachusetts is 2.0%.
What is the Percentage of Population Employed in Arts, Entertainment & Recreation in the United States?
Percentage of Population Employed in Arts, Entertainment & Recreation in the United States is 2.1%.