Cities with the Highest Percentage of Population Employed in Arts, Entertainment & Recreation in the United States
RELATED REPORTS & OPTIONS
Arts, Entertainment & Recreation
United States
Compare Cities
Map of Cities with the Highest Percentage of Population Employed in Arts, Entertainment & Recreation in the United States
0.0%
100.0%
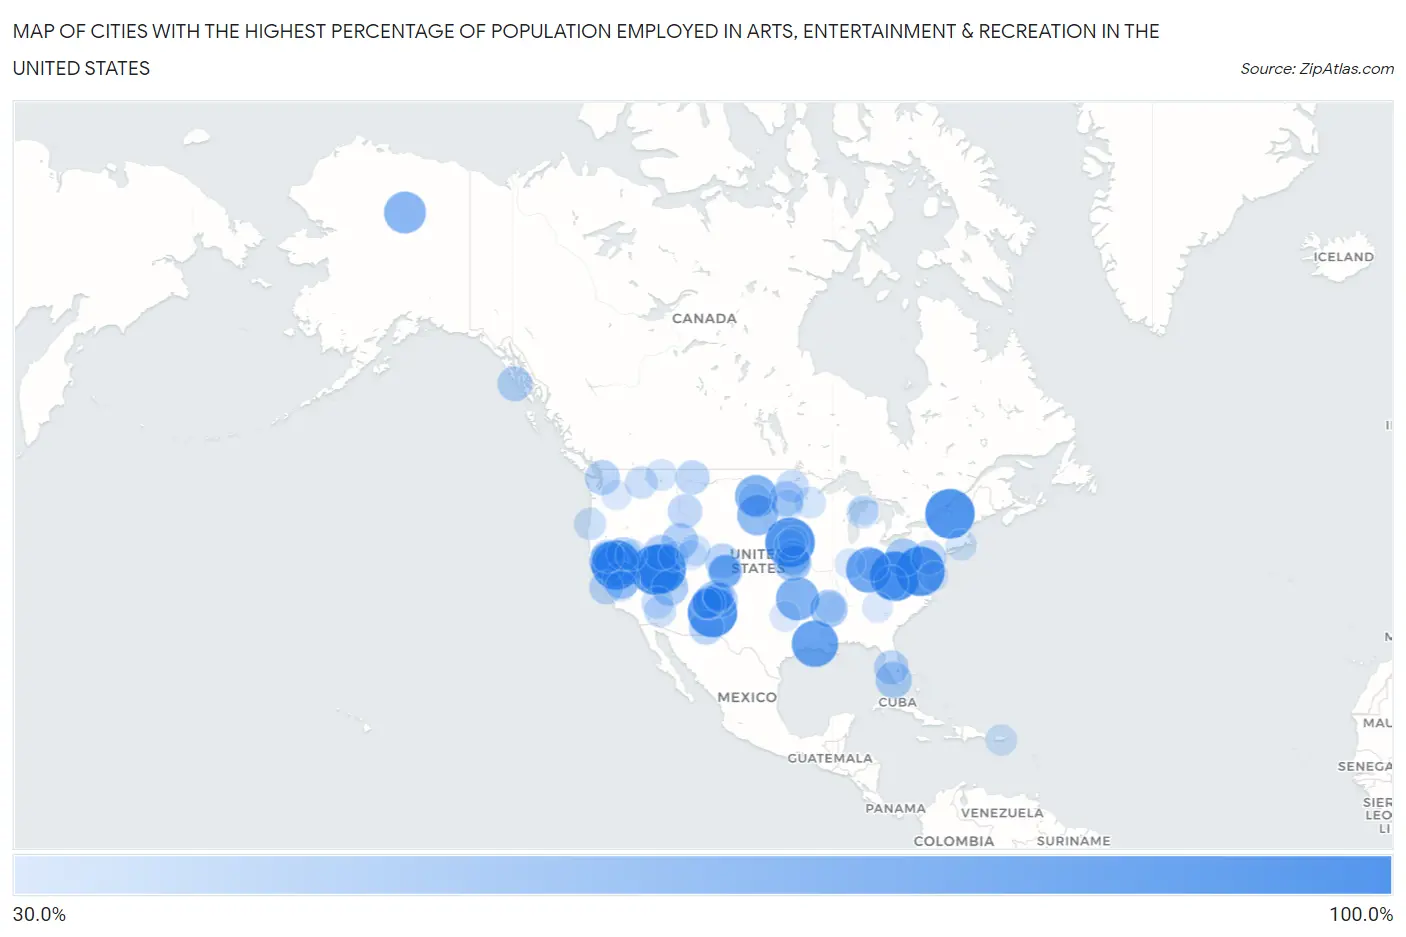
Cities with the Highest Percentage of Population Employed in Arts, Entertainment & Recreation in the United States
| City | % Employed | vs State | vs National | |
| 1. | Deep Water | 100.0% | 1.6%(+98.4)#1 | 2.1%(+97.9)#1 |
| 2. | Parc | 100.0% | 2.4%(+97.6)#1 | 2.1%(+97.9)#2 |
| 3. | Morrow | 100.0% | 2.2%(+97.8)#1 | 2.1%(+97.9)#3 |
| 4. | Lund | 100.0% | 7.6%(+92.4)#1 | 2.1%(+97.9)#4 |
| 5. | Blacktail | 100.0% | 2.0%(+98.0)#1 | 2.1%(+97.9)#5 |
| 6. | Kingvale | 100.0% | 2.6%(+97.4)#1 | 2.1%(+97.9)#6 |
| 7. | Calverton | 100.0% | 1.9%(+98.1)#1 | 2.1%(+97.9)#7 |
| 8. | Luis Lopez | 100.0% | 2.3%(+97.7)#1 | 2.1%(+97.9)#8 |
| 9. | Punta De Agua | 100.0% | 2.3%(+97.7)#2 | 2.1%(+97.9)#9 |
| 10. | Baker | 100.0% | 7.6%(+92.4)#2 | 2.1%(+97.9)#10 |
| 11. | River Sioux | 100.0% | 1.5%(+98.5)#1 | 2.1%(+97.9)#11 |
| 12. | Egan | 89.2% | 2.2%(+87.0)#2 | 2.1%(+87.2)#12 |
| 13. | Florence | 85.0% | 1.6%(+83.4)#1 | 2.1%(+82.9)#13 |
| 14. | Driftwood Borough | 83.3% | 1.8%(+81.5)#1 | 2.1%(+81.3)#14 |
| 15. | Box | 77.8% | 2.4%(+75.4)#1 | 2.1%(+75.7)#15 |
| 16. | Soda Springs | 77.8% | 2.6%(+75.2)#2 | 2.1%(+75.7)#16 |
| 17. | Solen | 75.0% | 2.0%(+73.0)#2 | 2.1%(+72.9)#17 |
| 18. | Wiseman | 73.7% | 2.1%(+71.6)#1 | 2.1%(+71.6)#18 |
| 19. | Edgewater Park | 71.8% | 2.4%(+69.4)#2 | 2.1%(+69.7)#19 |
| 20. | Cow Creek | 69.6% | 1.9%(+67.8)#1 | 2.1%(+67.6)#20 |
| 21. | Concow | 63.0% | 2.6%(+60.4)#3 | 2.1%(+60.9)#21 |
| 22. | Kickapoo Site 5 | 60.0% | 1.7%(+58.3)#1 | 2.1%(+57.9)#22 |
| 23. | Van Voorhis | 59.6% | 1.8%(+57.8)#2 | 2.1%(+57.5)#23 |
| 24. | Lula | 59.2% | 2.1%(+57.0)#1 | 2.1%(+57.1)#24 |
| 25. | Bear Valley Cdp Alpine County | 58.7% | 2.6%(+56.1)#4 | 2.1%(+56.6)#25 |
| 26. | El Portal | 57.5% | 2.6%(+55.0)#5 | 2.1%(+55.4)#26 |
| 27. | Lyndon Center | 55.6% | 2.8%(+52.8)#1 | 2.1%(+53.5)#27 |
| 28. | Paloma | 55.3% | 1.9%(+53.4)#1 | 2.1%(+53.2)#28 |
| 29. | Cane Beds | 54.9% | 2.3%(+52.6)#1 | 2.1%(+52.8)#29 |
| 30. | Chokoloskee | 54.6% | 2.9%(+51.7)#1 | 2.1%(+52.5)#30 |
| 31. | Garden | 53.8% | 2.1%(+51.8)#1 | 2.1%(+51.8)#31 |
| 32. | Wendover | 51.8% | 2.1%(+49.8)#2 | 2.1%(+49.8)#32 |
| 33. | Tucker | 51.7% | 1.3%(+50.4)#1 | 2.1%(+49.6)#33 |
| 34. | San Ysidro | 51.6% | 2.3%(+49.3)#3 | 2.1%(+49.6)#34 |
| 35. | Central City | 51.3% | 2.6%(+48.7)#1 | 2.1%(+49.2)#35 |
| 36. | Lamy | 51.0% | 2.3%(+48.6)#4 | 2.1%(+48.9)#36 |
| 37. | Goldfield | 50.3% | 2.6%(+47.8)#2 | 2.1%(+48.3)#37 |
| 38. | Northwest Stanwood | 50.0% | 2.1%(+47.9)#1 | 2.1%(+47.9)#38 |
| 39. | Port Alexander | 50.0% | 2.1%(+47.9)#2 | 2.1%(+47.9)#39 |
| 40. | Barada | 50.0% | 1.6%(+48.4)#1 | 2.1%(+47.9)#40 |
| 41. | Doran | 50.0% | 1.9%(+48.1)#1 | 2.1%(+47.9)#41 |
| 42. | Wautec | 50.0% | 2.6%(+47.4)#6 | 2.1%(+47.9)#42 |
| 43. | Dewey | 50.0% | 2.5%(+47.5)#1 | 2.1%(+47.9)#43 |
| 44. | Timber Hills | 49.5% | 1.8%(+47.7)#3 | 2.1%(+47.4)#44 |
| 45. | Pecan Park | 49.1% | 2.3%(+46.7)#5 | 2.1%(+47.0)#45 |
| 46. | Gardner | 48.6% | 2.9%(+45.7)#2 | 2.1%(+46.6)#46 |
| 47. | Dorchester | 48.6% | 2.1%(+46.5)#1 | 2.1%(+46.5)#47 |
| 48. | Mammoth | 47.8% | 1.9%(+45.9)#1 | 2.1%(+45.7)#48 |
| 49. | Rocky Boy S Agency | 47.4% | 2.5%(+44.9)#2 | 2.1%(+45.3)#49 |
| 50. | Iaeger | 47.1% | 1.6%(+45.5)#2 | 2.1%(+45.1)#50 |
| 51. | Empire | 46.9% | 7.6%(+39.3)#3 | 2.1%(+44.8)#51 |
| 52. | Proctor | 46.7% | 1.5%(+45.2)#1 | 2.1%(+44.6)#52 |
| 53. | Pajaro Dunes | 46.7% | 2.6%(+44.1)#7 | 2.1%(+44.6)#53 |
| 54. | Paguate | 46.4% | 2.3%(+44.1)#6 | 2.1%(+44.3)#54 |
| 55. | Roosevelt Estates | 46.3% | 2.3%(+44.0)#2 | 2.1%(+44.2)#55 |
| 56. | Haugan | 46.2% | 2.5%(+43.7)#3 | 2.1%(+44.1)#56 |
| 57. | Fort Klamath | 43.8% | 2.1%(+41.7)#1 | 2.1%(+41.7)#57 |
| 58. | Mineral | 43.8% | 2.6%(+41.2)#8 | 2.1%(+41.7)#58 |
| 59. | Selfridge | 43.4% | 2.0%(+41.4)#3 | 2.1%(+41.4)#59 |
| 60. | Pine Bend | 42.9% | 1.9%(+40.9)#2 | 2.1%(+40.8)#60 |
| 61. | Olde West Chester | 42.6% | 1.7%(+40.9)#1 | 2.1%(+40.5)#61 |
| 62. | Huetter | 42.4% | 1.8%(+40.6)#1 | 2.1%(+40.3)#62 |
| 63. | Cripple Creek | 42.4% | 2.6%(+39.8)#3 | 2.1%(+40.3)#63 |
| 64. | Seboyeta | 42.2% | 2.3%(+39.8)#7 | 2.1%(+40.1)#64 |
| 65. | Victor | 42.1% | 2.6%(+39.5)#4 | 2.1%(+40.0)#65 |
| 66. | Willis | 41.7% | 1.7%(+39.9)#2 | 2.1%(+39.6)#66 |
| 67. | Gardiner | 41.2% | 2.1%(+39.1)#2 | 2.1%(+39.1)#67 |
| 68. | Katherine | 40.7% | 2.3%(+38.4)#3 | 2.1%(+38.6)#68 |
| 69. | Bluewater | 40.5% | 2.6%(+37.9)#9 | 2.1%(+38.4)#69 |
| 70. | Cedar | 40.0% | 1.8%(+38.2)#1 | 2.1%(+37.9)#70 |
| 71. | Ceex Haci | 40.0% | 1.7%(+38.3)#1 | 2.1%(+37.9)#71 |
| 72. | Cuartelez | 39.7% | 2.3%(+37.3)#8 | 2.1%(+37.6)#72 |
| 73. | Olivia | 39.5% | 1.8%(+37.7)#4 | 2.1%(+37.5)#73 |
| 74. | La Plena | 39.2% | 1.2%(+37.9)#1 | 2.1%(+37.1)#74 |
| 75. | Borrego Pass | 38.9% | 2.3%(+36.5)#9 | 2.1%(+36.8)#75 |
| 76. | West Glacier | 38.8% | 2.5%(+36.3)#4 | 2.1%(+36.7)#76 |
| 77. | Humboldt River Ranch | 38.5% | 7.6%(+30.8)#4 | 2.1%(+36.4)#77 |
| 78. | Loveland | 38.5% | 1.5%(+36.9)#2 | 2.1%(+36.4)#78 |
| 79. | Henriette | 38.5% | 1.9%(+36.5)#3 | 2.1%(+36.4)#79 |
| 80. | Dutch John | 38.5% | 2.1%(+36.4)#3 | 2.1%(+36.4)#80 |
| 81. | Johnson | 38.5% | 1.9%(+36.5)#4 | 2.1%(+36.4)#81 |
| 82. | Mashantucket | 38.1% | 2.5%(+35.6)#1 | 2.1%(+36.0)#82 |
| 83. | Smithville | 37.2% | 1.9%(+35.3)#2 | 2.1%(+35.1)#83 |
| 84. | Neotsu | 36.9% | 2.1%(+34.8)#3 | 2.1%(+34.8)#84 |
| 85. | Friant | 36.8% | 2.6%(+34.3)#10 | 2.1%(+34.7)#85 |
| 86. | Bridgeville | 36.8% | 2.4%(+34.4)#2 | 2.1%(+34.7)#86 |
| 87. | White Oak | 36.4% | 2.1%(+34.3)#2 | 2.1%(+34.3)#87 |
| 88. | Blue Valley | 36.4% | 2.6%(+33.8)#5 | 2.1%(+34.3)#88 |
| 89. | Dorchester | 36.4% | 1.5%(+34.9)#2 | 2.1%(+34.3)#89 |
| 90. | Toad Hop | 36.1% | 1.6%(+34.4)#2 | 2.1%(+34.0)#90 |
| 91. | Mccartys Village | 35.9% | 2.3%(+33.6)#10 | 2.1%(+33.8)#91 |
| 92. | Yonah | 35.6% | 1.6%(+34.0)#1 | 2.1%(+33.5)#92 |
| 93. | Parker | 35.5% | 2.1%(+33.3)#2 | 2.1%(+33.4)#93 |
| 94. | Tesuque Pueblo | 35.3% | 2.3%(+33.0)#11 | 2.1%(+33.2)#94 |
| 95. | Canon | 35.2% | 2.3%(+32.9)#12 | 2.1%(+33.2)#95 |
| 96. | Ophir | 35.1% | 2.1%(+33.0)#4 | 2.1%(+33.1)#96 |
| 97. | Buck Grove | 35.0% | 1.5%(+33.5)#3 | 2.1%(+32.9)#97 |
| 98. | Omena | 34.6% | 1.8%(+32.8)#2 | 2.1%(+32.5)#98 |
| 99. | Whiterocks | 34.6% | 2.1%(+32.5)#5 | 2.1%(+32.5)#99 |
| 100. | Fairmount | 34.4% | 1.9%(+32.5)#1 | 2.1%(+32.3)#100 |
Common Questions
What are the Top 10 Cities with the Highest Percentage of Population Employed in Arts, Entertainment & Recreation in the United States?
Top 10 Cities with the Highest Percentage of Population Employed in Arts, Entertainment & Recreation in the United States are:
What city has the Highest Percentage of Population Employed in Arts, Entertainment & Recreation in the United States?
Deep Water has the Highest Percentage of Population Employed in Arts, Entertainment & Recreation in the United States with 100.0%.
What is the Percentage of Population Employed in Arts, Entertainment & Recreation in the United States?
Percentage of Population Employed in Arts, Entertainment & Recreation in the United States is 2.1%.