Cities with the Highest Percentage of Population Employed in Arts, Entertainment & Recreation in South Dakota
RELATED REPORTS & OPTIONS
Arts, Entertainment & Recreation
South Dakota
Compare Cities
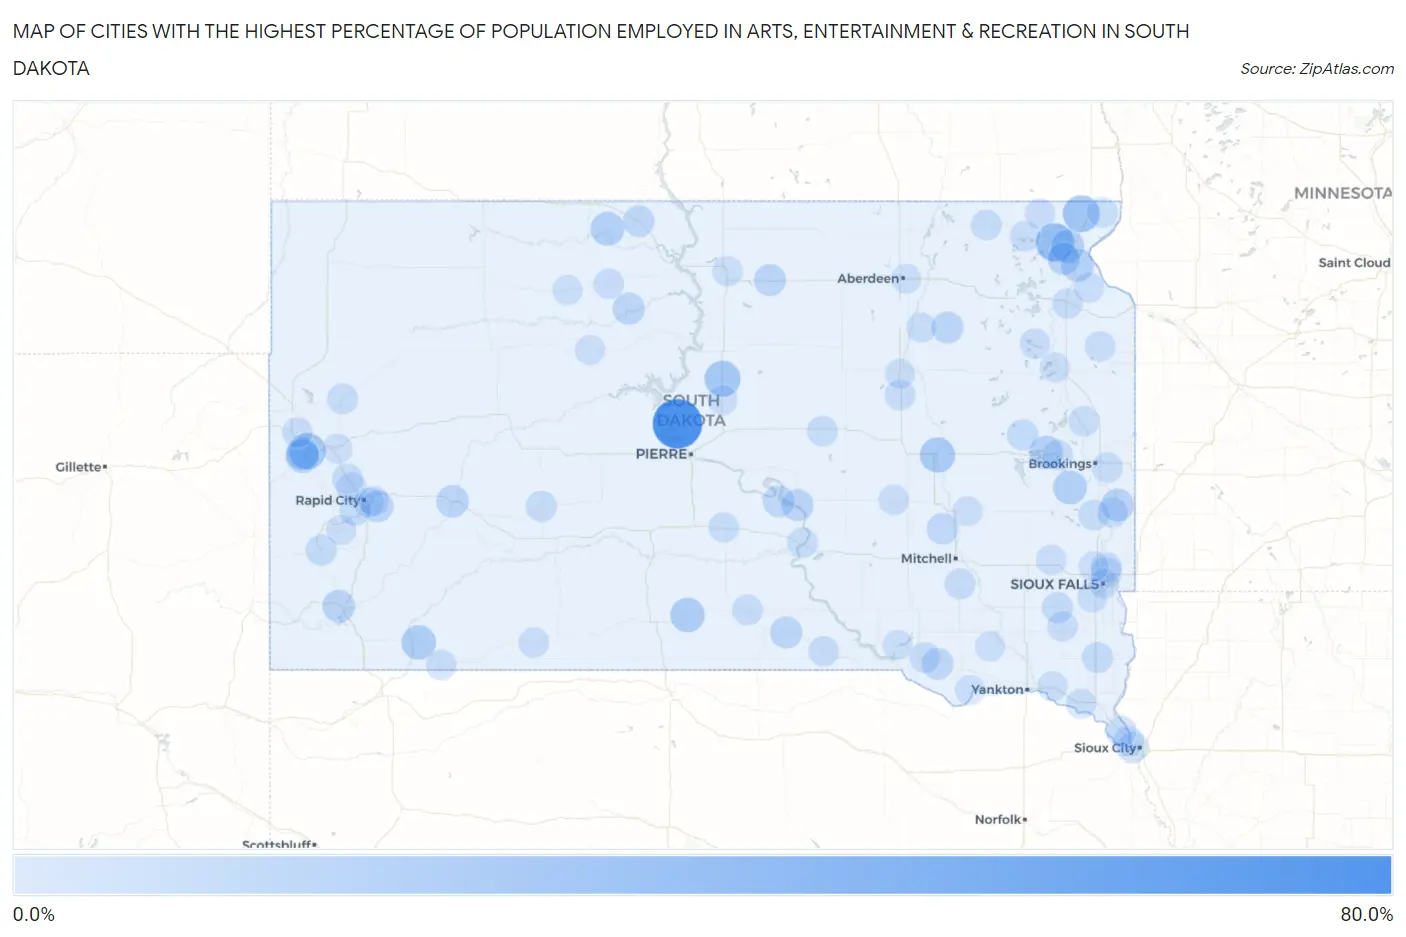
Map of Cities with the Highest Percentage of Population Employed in Arts, Entertainment & Recreation in South Dakota
0.0%
80.0%
Cities with the Highest Percentage of Population Employed in Arts, Entertainment & Recreation in South Dakota
| City | % Employed | vs State | vs National | |
| 1. | Cow Creek | 69.6% | 1.9%(+67.8)#1 | 2.1%(+67.6)#20 |
| 2. | Long Hollow | 29.8% | 1.9%(+27.9)#2 | 2.1%(+27.7)#123 |
| 3. | Peever Flats | 25.8% | 1.9%(+23.9)#3 | 2.1%(+23.7)#175 |
| 4. | New Effington | 24.7% | 1.9%(+22.8)#4 | 2.1%(+22.6)#186 |
| 5. | Deadwood | 22.5% | 1.9%(+20.6)#5 | 2.1%(+20.4)#222 |
| 6. | Agar | 21.2% | 1.9%(+19.3)#6 | 2.1%(+19.1)#240 |
| 7. | Morningside | 18.8% | 1.9%(+16.9)#7 | 2.1%(+16.7)#297 |
| 8. | Wakpala | 17.1% | 1.9%(+15.3)#8 | 2.1%(+15.1)#361 |
| 9. | Oglala | 16.0% | 1.9%(+14.2)#9 | 2.1%(+14.0)#410 |
| 10. | Okreek | 16.0% | 1.9%(+14.1)#10 | 2.1%(+13.9)#413 |
| 11. | West Brule | 15.8% | 1.9%(+13.9)#11 | 2.1%(+13.7)#419 |
| 12. | Oahe Acres | 14.3% | 1.9%(+12.4)#12 | 2.1%(+12.2)#502 |
| 13. | Nunda | 14.3% | 1.9%(+12.4)#13 | 2.1%(+12.2)#510 |
| 14. | Bullhead | 14.0% | 1.9%(+12.1)#14 | 2.1%(+11.9)#528 |
| 15. | Lead | 13.1% | 1.9%(+11.3)#15 | 2.1%(+11.1)#588 |
| 16. | Sisseton | 12.5% | 1.9%(+10.6)#16 | 2.1%(+10.4)#623 |
| 17. | Hetland | 12.5% | 1.9%(+10.6)#17 | 2.1%(+10.4)#632 |
| 18. | Mina | 12.4% | 1.9%(+10.5)#18 | 2.1%(+10.4)#637 |
| 19. | Peever | 12.0% | 1.9%(+10.1)#19 | 2.1%(+9.92)#673 |
| 20. | Flandreau | 10.5% | 1.9%(+8.64)#20 | 2.1%(+8.45)#824 |
| 21. | Hot Springs | 10.3% | 1.9%(+8.42)#21 | 2.1%(+8.23)#861 |
| 22. | Central City | 10.0% | 1.9%(+8.11)#22 | 2.1%(+7.92)#909 |
| 23. | Agency Village | 9.8% | 1.9%(+7.87)#23 | 2.1%(+7.67)#956 |
| 24. | Wasta | 9.7% | 1.9%(+7.79)#24 | 2.1%(+7.59)#971 |
| 25. | Green Valley | 8.3% | 1.9%(+6.39)#25 | 2.1%(+6.19)#1,231 |
| 26. | Dallas | 8.2% | 1.9%(+6.31)#26 | 2.1%(+6.11)#1,248 |
| 27. | Bowdle | 8.1% | 1.9%(+6.19)#27 | 2.1%(+6.00)#1,275 |
| 28. | Whitehorse | 8.1% | 1.9%(+6.18)#28 | 2.1%(+5.98)#1,281 |
| 29. | Fort Thompson | 8.0% | 1.9%(+6.12)#29 | 2.1%(+5.93)#1,294 |
| 30. | Conde | 8.0% | 1.9%(+6.11)#30 | 2.1%(+5.92)#1,299 |
| 31. | Dante | 7.7% | 1.9%(+5.80)#31 | 2.1%(+5.61)#1,395 |
| 32. | Letcher | 7.0% | 1.9%(+5.09)#32 | 2.1%(+4.89)#1,608 |
| 33. | Lower Brule | 6.9% | 1.9%(+5.02)#33 | 2.1%(+4.83)#1,620 |
| 34. | Mclaughlin | 6.9% | 1.9%(+5.02)#34 | 2.1%(+4.83)#1,621 |
| 35. | Kenel | 6.5% | 1.9%(+4.56)#35 | 2.1%(+4.37)#1,796 |
| 36. | Colonial Pine Hills | 5.3% | 1.9%(+3.45)#36 | 2.1%(+3.25)#2,364 |
| 37. | Custer | 5.2% | 1.9%(+3.30)#37 | 2.1%(+3.11)#2,463 |
| 38. | Erwin | 5.0% | 1.9%(+3.11)#38 | 2.1%(+2.92)#2,611 |
| 39. | Dakota Dunes | 4.9% | 1.9%(+3.00)#39 | 2.1%(+2.81)#2,685 |
| 40. | Beresford | 4.8% | 1.9%(+2.92)#40 | 2.1%(+2.72)#2,755 |
| 41. | Parker | 4.6% | 1.9%(+2.73)#41 | 2.1%(+2.53)#2,896 |
| 42. | Philip | 4.4% | 1.9%(+2.48)#42 | 2.1%(+2.28)#3,183 |
| 43. | Ethan | 4.3% | 1.9%(+2.38)#43 | 2.1%(+2.19)#3,316 |
| 44. | Meadow View Addition | 4.1% | 1.9%(+2.23)#44 | 2.1%(+2.04)#3,498 |
| 45. | Wagner | 4.0% | 1.9%(+2.12)#45 | 2.1%(+1.92)#3,620 |
| 46. | Britton | 4.0% | 1.9%(+2.10)#46 | 2.1%(+1.91)#3,646 |
| 47. | Colman | 3.9% | 1.9%(+2.04)#47 | 2.1%(+1.85)#3,723 |
| 48. | Piedmont | 3.8% | 1.9%(+1.87)#48 | 2.1%(+1.67)#3,966 |
| 49. | Herrick | 3.7% | 1.9%(+1.82)#49 | 2.1%(+1.62)#4,067 |
| 50. | Ree Heights | 3.7% | 1.9%(+1.82)#50 | 2.1%(+1.62)#4,069 |
| 51. | Winner | 3.7% | 1.9%(+1.81)#51 | 2.1%(+1.62)#4,071 |
| 52. | Newell | 3.7% | 1.9%(+1.77)#52 | 2.1%(+1.58)#4,129 |
| 53. | Tulare | 3.7% | 1.9%(+1.77)#53 | 2.1%(+1.58)#4,134 |
| 54. | Wonderland Homes | 3.5% | 1.9%(+1.66)#54 | 2.1%(+1.46)#4,310 |
| 55. | Arlington | 3.5% | 1.9%(+1.63)#55 | 2.1%(+1.44)#4,355 |
| 56. | Boulder Canyon | 3.5% | 1.9%(+1.59)#56 | 2.1%(+1.40)#4,429 |
| 57. | Aurora | 3.4% | 1.9%(+1.56)#57 | 2.1%(+1.37)#4,485 |
| 58. | Renner Corner | 3.4% | 1.9%(+1.51)#58 | 2.1%(+1.32)#4,594 |
| 59. | Oacoma | 3.4% | 1.9%(+1.49)#59 | 2.1%(+1.30)#4,631 |
| 60. | Florence | 3.4% | 1.9%(+1.47)#60 | 2.1%(+1.27)#4,673 |
| 61. | Estelline | 3.4% | 1.9%(+1.47)#61 | 2.1%(+1.27)#4,681 |
| 62. | Timber Lake | 3.1% | 1.9%(+1.25)#62 | 2.1%(+1.05)#5,094 |
| 63. | Summit | 3.1% | 1.9%(+1.20)#63 | 2.1%(+1.00)#5,211 |
| 64. | North Sioux City | 3.1% | 1.9%(+1.18)#64 | 2.1%(+0.990)#5,247 |
| 65. | Lake City | 3.0% | 1.9%(+1.14)#65 | 2.1%(+0.948)#5,335 |
| 66. | Rosholt | 3.0% | 1.9%(+1.12)#66 | 2.1%(+0.930)#5,369 |
| 67. | Spearfish | 3.0% | 1.9%(+1.09)#67 | 2.1%(+0.894)#5,444 |
| 68. | Hurley | 3.0% | 1.9%(+1.09)#68 | 2.1%(+0.894)#5,446 |
| 69. | Egan | 3.0% | 1.9%(+1.08)#69 | 2.1%(+0.888)#5,459 |
| 70. | Jefferson | 2.9% | 1.9%(+1.05)#70 | 2.1%(+0.859)#5,531 |
| 71. | Martin | 2.9% | 1.9%(+1.05)#71 | 2.1%(+0.851)#5,547 |
| 72. | Strandburg | 2.9% | 1.9%(+0.969)#72 | 2.1%(+0.775)#5,757 |
| 73. | Wilmot | 2.8% | 1.9%(+0.874)#73 | 2.1%(+0.680)#6,004 |
| 74. | Blackhawk | 2.6% | 1.9%(+0.743)#74 | 2.1%(+0.549)#6,394 |
| 75. | Pine Ridge | 2.6% | 1.9%(+0.696)#75 | 2.1%(+0.501)#6,531 |
| 76. | Wessington Springs | 2.6% | 1.9%(+0.676)#76 | 2.1%(+0.482)#6,588 |
| 77. | Presho | 2.6% | 1.9%(+0.665)#77 | 2.1%(+0.471)#6,632 |
| 78. | Rapid City | 2.5% | 1.9%(+0.612)#78 | 2.1%(+0.418)#6,816 |
| 79. | Selby | 2.5% | 1.9%(+0.601)#79 | 2.1%(+0.407)#6,858 |
| 80. | Tea | 2.5% | 1.9%(+0.578)#80 | 2.1%(+0.384)#6,927 |
| 81. | Brentford | 2.4% | 1.9%(+0.551)#81 | 2.1%(+0.356)#7,039 |
| 82. | Montrose | 2.4% | 1.9%(+0.543)#82 | 2.1%(+0.349)#7,060 |
| 83. | Vermillion | 2.4% | 1.9%(+0.490)#83 | 2.1%(+0.296)#7,230 |
| 84. | Veblen | 2.3% | 1.9%(+0.451)#84 | 2.1%(+0.257)#7,364 |
| 85. | Rapid Valley | 2.3% | 1.9%(+0.421)#85 | 2.1%(+0.227)#7,463 |
| 86. | North Eagle Butte | 2.2% | 1.9%(+0.356)#86 | 2.1%(+0.162)#7,703 |
| 87. | Springfield | 2.2% | 1.9%(+0.322)#87 | 2.1%(+0.127)#7,824 |
| 88. | Isabel | 2.2% | 1.9%(+0.286)#88 | 2.1%(+0.091)#7,973 |
| 89. | Onida | 2.1% | 1.9%(+0.252)#89 | 2.1%(+0.058)#8,101 |
| 90. | Lake Andes | 2.0% | 1.9%(+0.112)#90 | 2.1%(-0.083)#8,705 |
| 91. | Sturgis | 2.0% | 1.9%(+0.107)#91 | 2.1%(-0.087)#8,731 |
| 92. | Watertown | 2.0% | 1.9%(+0.106)#92 | 2.1%(-0.088)#8,733 |
| 93. | Gayville | 1.9% | 1.9%(+0.057)#93 | 2.1%(-0.137)#8,935 |
| 94. | Artesian | 1.9% | 1.9%(+0.035)#94 | 2.1%(-0.159)#9,016 |
| 95. | Sioux Falls | 1.9% | 1.9%(-0.003)#95 | 2.1%(-0.198)#9,220 |
| 96. | Keystone | 1.9% | 1.9%(-0.028)#96 | 2.1%(-0.222)#9,308 |
| 97. | Redfield | 1.8% | 1.9%(-0.055)#97 | 2.1%(-0.249)#9,441 |
| 98. | Scotland | 1.8% | 1.9%(-0.087)#98 | 2.1%(-0.281)#9,613 |
| 99. | Crooks | 1.8% | 1.9%(-0.106)#99 | 2.1%(-0.301)#9,710 |
| 100. | Aberdeen | 1.7% | 1.9%(-0.144)#100 | 2.1%(-0.338)#9,880 |
Common Questions
What are the Top 10 Cities with the Highest Percentage of Population Employed in Arts, Entertainment & Recreation in South Dakota?
Top 10 Cities with the Highest Percentage of Population Employed in Arts, Entertainment & Recreation in South Dakota are:
#1
69.6%
#2
29.8%
#3
24.7%
#4
22.5%
#5
21.2%
#6
18.8%
#7
16.0%
#8
16.0%
#9
14.3%
#10
14.0%
What city has the Highest Percentage of Population Employed in Arts, Entertainment & Recreation in South Dakota?
Cow Creek has the Highest Percentage of Population Employed in Arts, Entertainment & Recreation in South Dakota with 69.6%.
What is the Percentage of Population Employed in Arts, Entertainment & Recreation in the State of South Dakota?
Percentage of Population Employed in Arts, Entertainment & Recreation in South Dakota is 1.9%.
What is the Percentage of Population Employed in Arts, Entertainment & Recreation in the United States?
Percentage of Population Employed in Arts, Entertainment & Recreation in the United States is 2.1%.