Cities with the Highest Percentage of Population Employed in Arts, Entertainment & Recreation in Puerto Rico
RELATED REPORTS & OPTIONS
Arts, Entertainment & Recreation
Puerto Rico
Compare Cities
Map of Cities with the Highest Percentage of Population Employed in Arts, Entertainment & Recreation in Puerto Rico
0.0%
40.0%
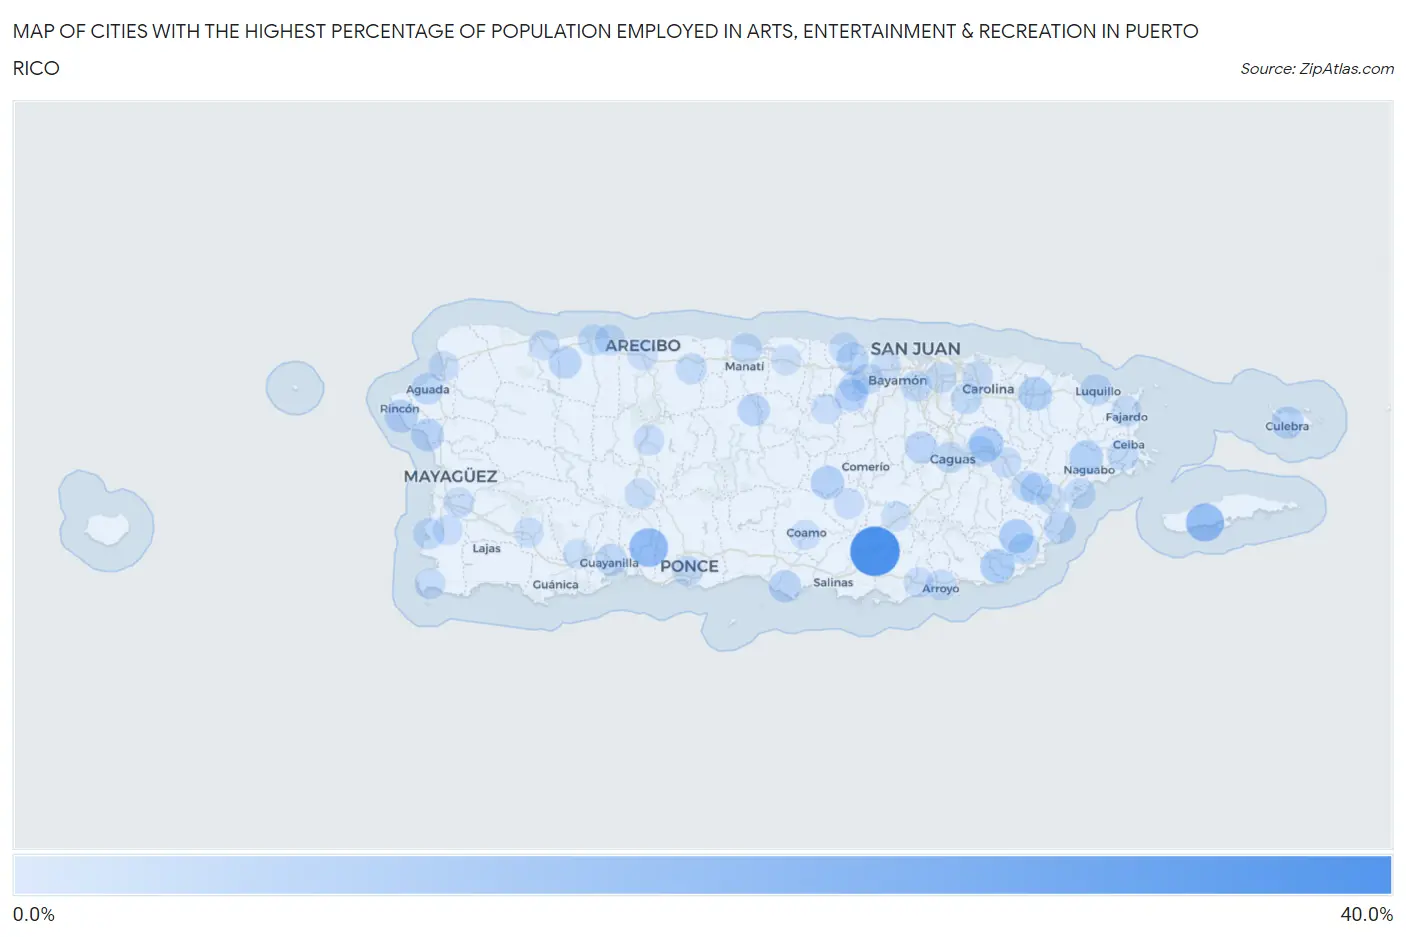
Cities with the Highest Percentage of Population Employed in Arts, Entertainment & Recreation in Puerto Rico
| City | % Employed | vs State | vs National | |
| 1. | La Plena | 39.2% | 1.2% (+37.9)#1 | 2.1% (+37.1)#74 |
| 2. | Anton Ruiz | 17.2% | 1.2% (+16.0)#2 | 2.1% (+15.2)#351 |
| 3. | Tallaboa Alta | 17.1% | 1.2% (+15.9)#3 | 2.1% (+15.1)#359 |
| 4. | Esperanza | 15.7% | 1.2% (+14.5)#4 | 2.1% (+13.6)#424 |
| 5. | Lomas Verdes | 15.2% | 1.2% (+14.0)#5 | 2.1% (+13.1)#452 |
| 6. | Corazon | 12.1% | 1.2% (+10.9)#6 | 2.1% (+10.0)#662 |
| 7. | Palo Seco | 8.6% | 1.2% (+7.40)#7 | 2.1% (+6.56)#1,148 |
| 8. | Martorell | 8.3% | 1.2% (+7.10)#8 | 2.1% (+6.27)#1,210 |
| 9. | Celada | 8.3% | 1.2% (+7.06)#9 | 2.1% (+6.22)#1,225 |
| 10. | Villa Hugo Ii | 7.9% | 1.2% (+6.65)#10 | 2.1% (+5.81)#1,324 |
| 11. | Rio Blanco | 7.6% | 1.2% (+6.31)#11 | 2.1% (+5.48)#1,435 |
| 12. | La Dolores | 7.5% | 1.2% (+6.28)#12 | 2.1% (+5.44)#1,452 |
| 13. | Rafael Gonzalez | 7.4% | 1.2% (+6.15)#13 | 2.1% (+5.32)#1,491 |
| 14. | Duque | 7.3% | 1.2% (+6.07)#14 | 2.1% (+5.23)#1,505 |
| 15. | Barranquitas | 6.9% | 1.2% (+5.69)#15 | 2.1% (+4.85)#1,614 |
| 16. | Palma Sola | 6.2% | 1.2% (+4.93)#16 | 2.1% (+4.09)#1,907 |
| 17. | Stella | 6.1% | 1.2% (+4.82)#17 | 2.1% (+3.98)#1,941 |
| 18. | San Jose | 5.9% | 1.2% (+4.61)#18 | 2.1% (+3.77)#2,056 |
| 19. | Galateo | 5.4% | 1.2% (+4.15)#19 | 2.1% (+3.31)#2,331 |
| 20. | La Playa | 5.2% | 1.2% (+3.93)#20 | 2.1% (+3.09)#2,469 |
| 21. | Anasco | 4.9% | 1.2% (+3.66)#21 | 2.1% (+2.82)#2,679 |
| 22. | Piedra Gorda | 4.7% | 1.2% (+3.45)#22 | 2.1% (+2.61)#2,831 |
| 23. | Culebra | 4.5% | 1.2% (+3.24)#23 | 2.1% (+2.40)#3,053 |
| 24. | Santa Isabel | 4.4% | 1.2% (+3.19)#24 | 2.1% (+2.35)#3,114 |
| 25. | Las Gaviotas | 4.4% | 1.2% (+3.16)#25 | 2.1% (+2.32)#3,146 |
| 26. | Aguas Buenas | 4.4% | 1.2% (+3.16)#26 | 2.1% (+2.32)#3,149 |
| 27. | Toa Baja | 4.2% | 1.2% (+2.97)#27 | 2.1% (+2.13)#3,358 |
| 28. | Ciales | 4.2% | 1.2% (+2.97)#28 | 2.1% (+2.13)#3,366 |
| 29. | Palmas Del Mar | 4.2% | 1.2% (+2.93)#29 | 2.1% (+2.09)#3,404 |
| 30. | Hacienda San Jose | 3.9% | 1.2% (+2.67)#30 | 2.1% (+1.83)#3,749 |
| 31. | San Sebastian | 3.8% | 1.2% (+2.57)#31 | 2.1% (+1.73)#3,880 |
| 32. | Luquillo | 3.7% | 1.2% (+2.44)#32 | 2.1% (+1.60)#4,102 |
| 33. | La Fermina | 3.6% | 1.2% (+2.40)#33 | 2.1% (+1.56)#4,151 |
| 34. | Guayanilla | 3.3% | 1.2% (+2.08)#34 | 2.1% (+1.25)#4,730 |
| 35. | Aguada | 3.3% | 1.2% (+2.04)#35 | 2.1% (+1.20)#4,807 |
| 36. | Liborio Negron Torres | 3.3% | 1.2% (+2.04)#36 | 2.1% (+1.20)#4,812 |
| 37. | Vazquez | 3.2% | 1.2% (+1.98)#37 | 2.1% (+1.14)#4,929 |
| 38. | Brenas | 3.0% | 1.2% (+1.76)#38 | 2.1% (+0.922)#5,378 |
| 39. | Manati | 2.9% | 1.2% (+1.66)#39 | 2.1% (+0.822)#5,611 |
| 40. | Canovanas | 2.9% | 1.2% (+1.63)#40 | 2.1% (+0.792)#5,695 |
| 41. | Aguas Claras | 2.7% | 1.2% (+1.48)#41 | 2.1% (+0.640)#6,120 |
| 42. | Yabucoa | 2.7% | 1.2% (+1.45)#42 | 2.1% (+0.609)#6,220 |
| 43. | Guaynabo | 2.5% | 1.2% (+1.28)#43 | 2.1% (+0.439)#6,753 |
| 44. | Boqueron Comunidad Cabo Rojo Municipio | 2.4% | 1.2% (+1.20)#44 | 2.1% (+0.364)#6,994 |
| 45. | Gurabo | 2.4% | 1.2% (+1.13)#45 | 2.1% (+0.293)#7,245 |
| 46. | Hatillo | 2.2% | 1.2% (+0.935)#46 | 2.1% (+0.096)#7,942 |
| 47. | Puerto Real | 2.2% | 1.2% (+0.922)#47 | 2.1% (+0.084)#8,008 |
| 48. | Tierras Nuevas Poniente | 2.2% | 1.2% (+0.912)#48 | 2.1% (+0.074)#8,046 |
| 49. | Trujillo Alto | 2.1% | 1.2% (+0.898)#49 | 2.1% (+0.059)#8,097 |
| 50. | Santa Barbara | 2.0% | 1.2% (+0.760)#50 | 2.1% (-0.079)#8,685 |
| 51. | Sabana Hoyos | 2.0% | 1.2% (+0.758)#51 | 2.1% (-0.080)#8,690 |
| 52. | Las Piedras | 2.0% | 1.2% (+0.707)#52 | 2.1% (-0.131)#8,907 |
| 53. | Mayaguez | 1.9% | 1.2% (+0.679)#53 | 2.1% (-0.160)#9,019 |
| 54. | Caguas | 1.9% | 1.2% (+0.669)#54 | 2.1% (-0.169)#9,062 |
| 55. | Punta Santiago | 1.9% | 1.2% (+0.665)#55 | 2.1% (-0.173)#9,086 |
| 56. | Brisas Del Campanero | 1.9% | 1.2% (+0.646)#56 | 2.1% (-0.193)#9,182 |
| 57. | Candelaria | 1.8% | 1.2% (+0.594)#57 | 2.1% (-0.245)#9,417 |
| 58. | Mansión Del Mar | 1.8% | 1.2% (+0.522)#58 | 2.1% (-0.316)#9,772 |
| 59. | San Juan | 1.7% | 1.2% (+0.485)#59 | 2.1% (-0.354)#9,955 |
| 60. | Toa Alta | 1.6% | 1.2% (+0.397)#60 | 2.1% (-0.441)#10,396 |
| 61. | Carrizales | 1.6% | 1.2% (+0.324)#61 | 2.1% (-0.514)#10,765 |
| 62. | Adjuntas | 1.6% | 1.2% (+0.308)#62 | 2.1% (-0.530)#10,843 |
| 63. | Utuado | 1.5% | 1.2% (+0.303)#63 | 2.1% (-0.536)#10,869 |
| 64. | Arroyo | 1.5% | 1.2% (+0.285)#64 | 2.1% (-0.554)#10,972 |
| 65. | Fajardo | 1.5% | 1.2% (+0.255)#65 | 2.1% (-0.583)#11,134 |
| 66. | San German | 1.5% | 1.2% (+0.250)#66 | 2.1% (-0.588)#11,156 |
| 67. | Ponce | 1.5% | 1.2% (+0.216)#67 | 2.1% (-0.623)#11,333 |
| 68. | Catano | 1.4% | 1.2% (+0.191)#68 | 2.1% (-0.647)#11,465 |
| 69. | Carolina | 1.4% | 1.2% (+0.187)#69 | 2.1% (-0.651)#11,486 |
| 70. | Coqui | 1.4% | 1.2% (+0.162)#70 | 2.1% (-0.676)#11,628 |
| 71. | Pole Ojea | 1.4% | 1.2% (+0.148)#71 | 2.1% (-0.690)#11,721 |
| 72. | San Antonio Comunidad Quebradillas Municipio | 1.3% | 1.2% (+0.031)#72 | 2.1% (-0.807)#12,307 |
| 73. | Juana Diaz | 1.3% | 1.2% (+0.009)#73 | 2.1% (-0.829)#12,408 |
| 74. | Penuelas | 1.2% | 1.2% (-0.048)#74 | 2.1% (-0.887)#12,696 |
| 75. | Arecibo | 1.2% | 1.2% (-0.072)#75 | 2.1% (-0.911)#12,826 |
| 76. | Hormigueros | 1.0% | 1.2% (-0.226)#76 | 2.1% (-1.06)#13,627 |
| 77. | Aibonito | 0.97% | 1.2% (-0.278)#77 | 2.1% (-1.12)#13,911 |
| 78. | Quebradillas | 0.85% | 1.2% (-0.393)#78 | 2.1% (-1.23)#14,500 |
| 79. | Bayamón | 0.80% | 1.2% (-0.447)#79 | 2.1% (-1.28)#14,769 |
| 80. | Aguadilla | 0.74% | 1.2% (-0.504)#80 | 2.1% (-1.34)#15,078 |
| 81. | Caño Martin Peña | 0.74% | 1.2% (-0.506)#81 | 2.1% (-1.34)#15,084 |
| 82. | Guayama | 0.73% | 1.2% (-0.517)#82 | 2.1% (-1.36)#15,141 |
| 83. | Cabo Rojo | 0.61% | 1.2% (-0.636)#83 | 2.1% (-1.47)#15,783 |
| 84. | Juncos | 0.59% | 1.2% (-0.652)#84 | 2.1% (-1.49)#15,866 |
| 85. | Corozal | 0.59% | 1.2% (-0.653)#85 | 2.1% (-1.49)#15,872 |
| 86. | Yauco | 0.53% | 1.2% (-0.713)#86 | 2.1% (-1.55)#16,140 |
| 87. | Humacao | 0.51% | 1.2% (-0.734)#87 | 2.1% (-1.57)#16,234 |
| 88. | Dorado | 0.49% | 1.2% (-0.752)#88 | 2.1% (-1.59)#16,340 |
| 89. | Coamo | 0.48% | 1.2% (-0.766)#89 | 2.1% (-1.60)#16,411 |
| 90. | Vega Baja | 0.43% | 1.2% (-0.815)#90 | 2.1% (-1.65)#16,637 |
| 91. | Sabana Seca | 0.41% | 1.2% (-0.838)#91 | 2.1% (-1.68)#16,727 |
| 92. | Cayey | 0.36% | 1.2% (-0.882)#92 | 2.1% (-1.72)#16,898 |
| 93. | Sabana Grande | 0.26% | 1.2% (-0.989)#93 | 2.1% (-1.83)#17,244 |
| 94. | Rio Grande | 0.24% | 1.2% (-1.01)#94 | 2.1% (-1.85)#17,290 |
Common Questions
What are the Top 10 Cities with the Highest Percentage of Population Employed in Arts, Entertainment & Recreation in Puerto Rico?
Top 10 Cities with the Highest Percentage of Population Employed in Arts, Entertainment & Recreation in Puerto Rico are:
#1
39.2%
#2
17.1%
#3
15.7%
#4
8.6%
#5
8.3%
#6
8.3%
#7
7.5%
#8
7.3%
#9
6.9%
#10
6.1%
What city has the Highest Percentage of Population Employed in Arts, Entertainment & Recreation in Puerto Rico?
La Plena has the Highest Percentage of Population Employed in Arts, Entertainment & Recreation in Puerto Rico with 39.2%.
What is the Percentage of Population Employed in Arts, Entertainment & Recreation in the State of Puerto Rico?
Percentage of Population Employed in Arts, Entertainment & Recreation in Puerto Rico is 1.2%.
What is the Percentage of Population Employed in Arts, Entertainment & Recreation in the United States?
Percentage of Population Employed in Arts, Entertainment & Recreation in the United States is 2.1%.