Zip Codes with the Highest Percentage of Population Employed in Arts, Entertainment & Recreation in Puyallup, WA
RELATED REPORTS & OPTIONS
Arts, Entertainment & Recreation
Puyallup
Compare Zip Codes
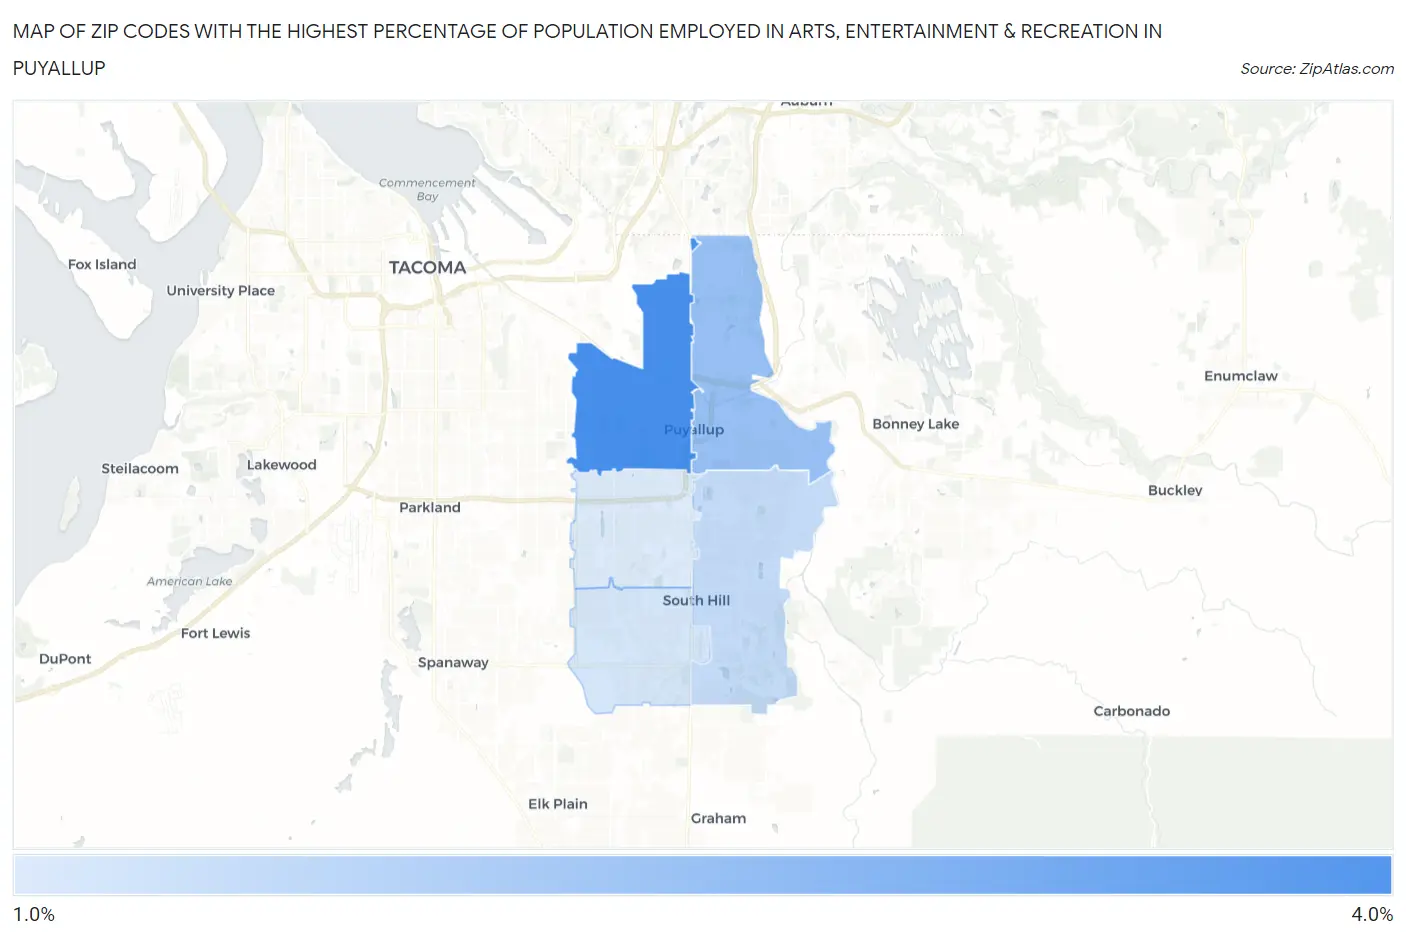
Map of Zip Codes with the Highest Percentage of Population Employed in Arts, Entertainment & Recreation in Puyallup
1.5%
3.3%
Zip Codes with the Highest Percentage of Population Employed in Arts, Entertainment & Recreation in Puyallup, WA
| Zip Code | % Employed | vs State | vs National | |
| 1. | 98371 | 3.3% | 2.1%(+1.14)#120 | 2.1%(+1.20)#4,599 |
| 2. | 98372 | 2.3% | 2.1%(+0.200)#200 | 2.1%(+0.264)#7,892 |
| 3. | 98374 | 1.8% | 2.1%(-0.300)#265 | 2.1%(-0.236)#10,708 |
| 4. | 98375 | 1.6% | 2.1%(-0.536)#300 | 2.1%(-0.472)#12,383 |
| 5. | 98373 | 1.5% | 2.1%(-0.604)#308 | 2.1%(-0.540)#12,934 |
1
Common Questions
What are the Top 3 Zip Codes with the Highest Percentage of Population Employed in Arts, Entertainment & Recreation in Puyallup, WA?
Top 3 Zip Codes with the Highest Percentage of Population Employed in Arts, Entertainment & Recreation in Puyallup, WA are:
What zip code has the Highest Percentage of Population Employed in Arts, Entertainment & Recreation in Puyallup, WA?
98371 has the Highest Percentage of Population Employed in Arts, Entertainment & Recreation in Puyallup, WA with 3.3%.
What is the Percentage of Population Employed in Arts, Entertainment & Recreation in Puyallup, WA?
Percentage of Population Employed in Arts, Entertainment & Recreation in Puyallup is 1.3%.
What is the Percentage of Population Employed in Arts, Entertainment & Recreation in Washington?
Percentage of Population Employed in Arts, Entertainment & Recreation in Washington is 2.1%.
What is the Percentage of Population Employed in Arts, Entertainment & Recreation in the United States?
Percentage of Population Employed in Arts, Entertainment & Recreation in the United States is 2.1%.