Zip Codes with the Highest Percentage of Population Employed in Arts, Entertainment & Recreation in Redmond, WA
RELATED REPORTS & OPTIONS
Arts, Entertainment & Recreation
Redmond
Compare Zip Codes
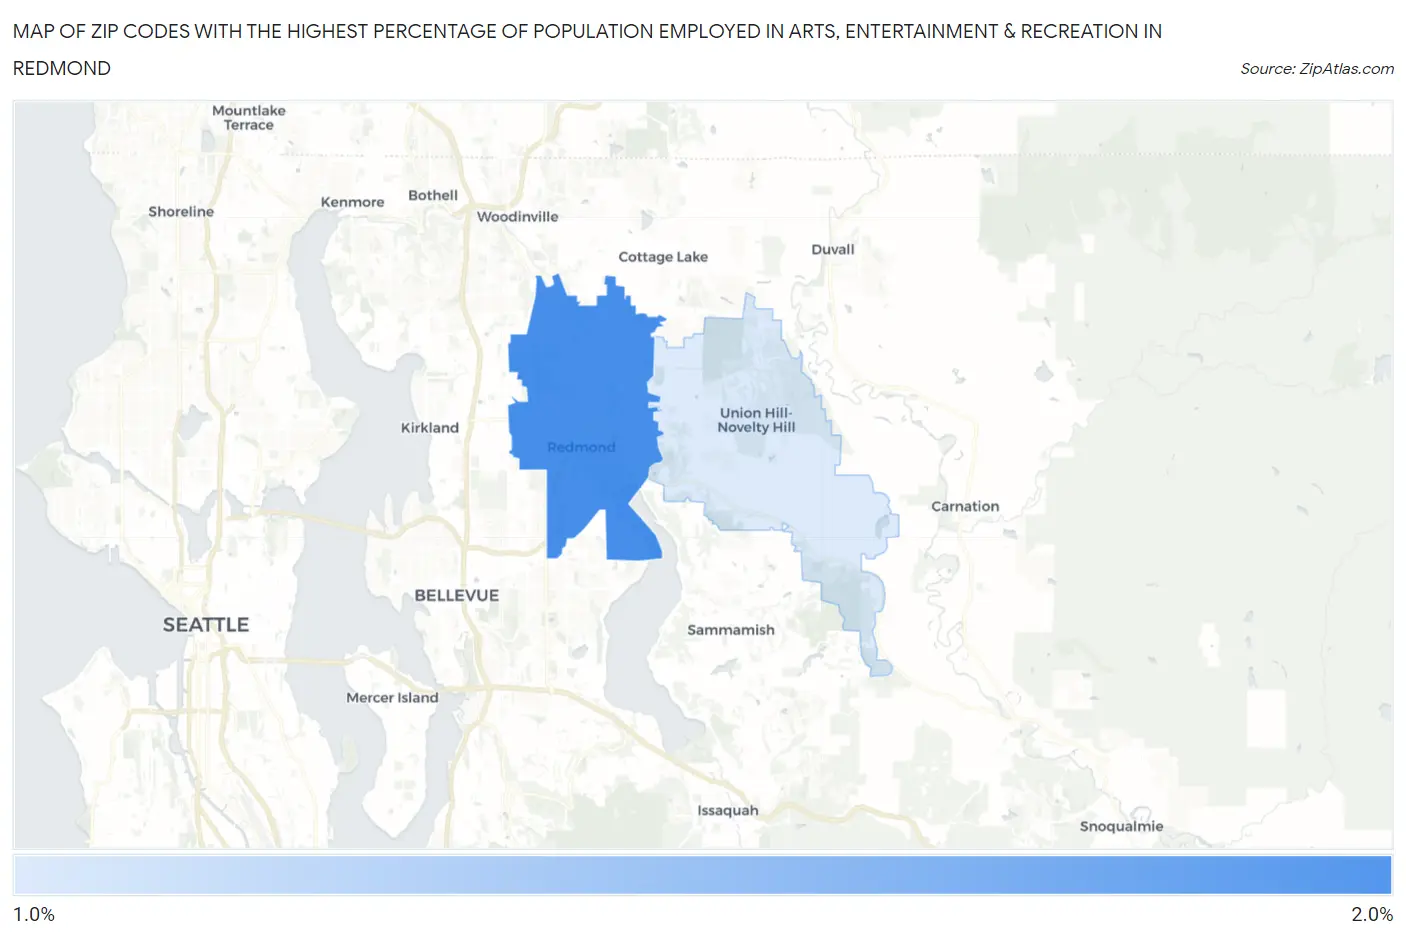
Map of Zip Codes with the Highest Percentage of Population Employed in Arts, Entertainment & Recreation in Redmond
1.6%
1.7%
Zip Codes with the Highest Percentage of Population Employed in Arts, Entertainment & Recreation in Redmond, WA
| Zip Code | % Employed | vs State | vs National | |
| 1. | 98052 | 1.7% | 2.1%(-0.441)#283 | 2.1%(-0.377)#11,695 |
| 2. | 98053 | 1.6% | 2.1%(-0.537)#301 | 2.1%(-0.473)#12,393 |
1
Common Questions
What are the Top Zip Codes with the Highest Percentage of Population Employed in Arts, Entertainment & Recreation in Redmond, WA?
Top Zip Codes with the Highest Percentage of Population Employed in Arts, Entertainment & Recreation in Redmond, WA are:
What zip code has the Highest Percentage of Population Employed in Arts, Entertainment & Recreation in Redmond, WA?
98052 has the Highest Percentage of Population Employed in Arts, Entertainment & Recreation in Redmond, WA with 1.7%.
What is the Percentage of Population Employed in Arts, Entertainment & Recreation in Redmond, WA?
Percentage of Population Employed in Arts, Entertainment & Recreation in Redmond is 1.6%.
What is the Percentage of Population Employed in Arts, Entertainment & Recreation in Washington?
Percentage of Population Employed in Arts, Entertainment & Recreation in Washington is 2.1%.
What is the Percentage of Population Employed in Arts, Entertainment & Recreation in the United States?
Percentage of Population Employed in Arts, Entertainment & Recreation in the United States is 2.1%.