Cities with the Highest Percentage of Population Employed in Arts, Entertainment & Recreation in Maryland
RELATED REPORTS & OPTIONS
Arts, Entertainment & Recreation
Maryland
Compare Cities
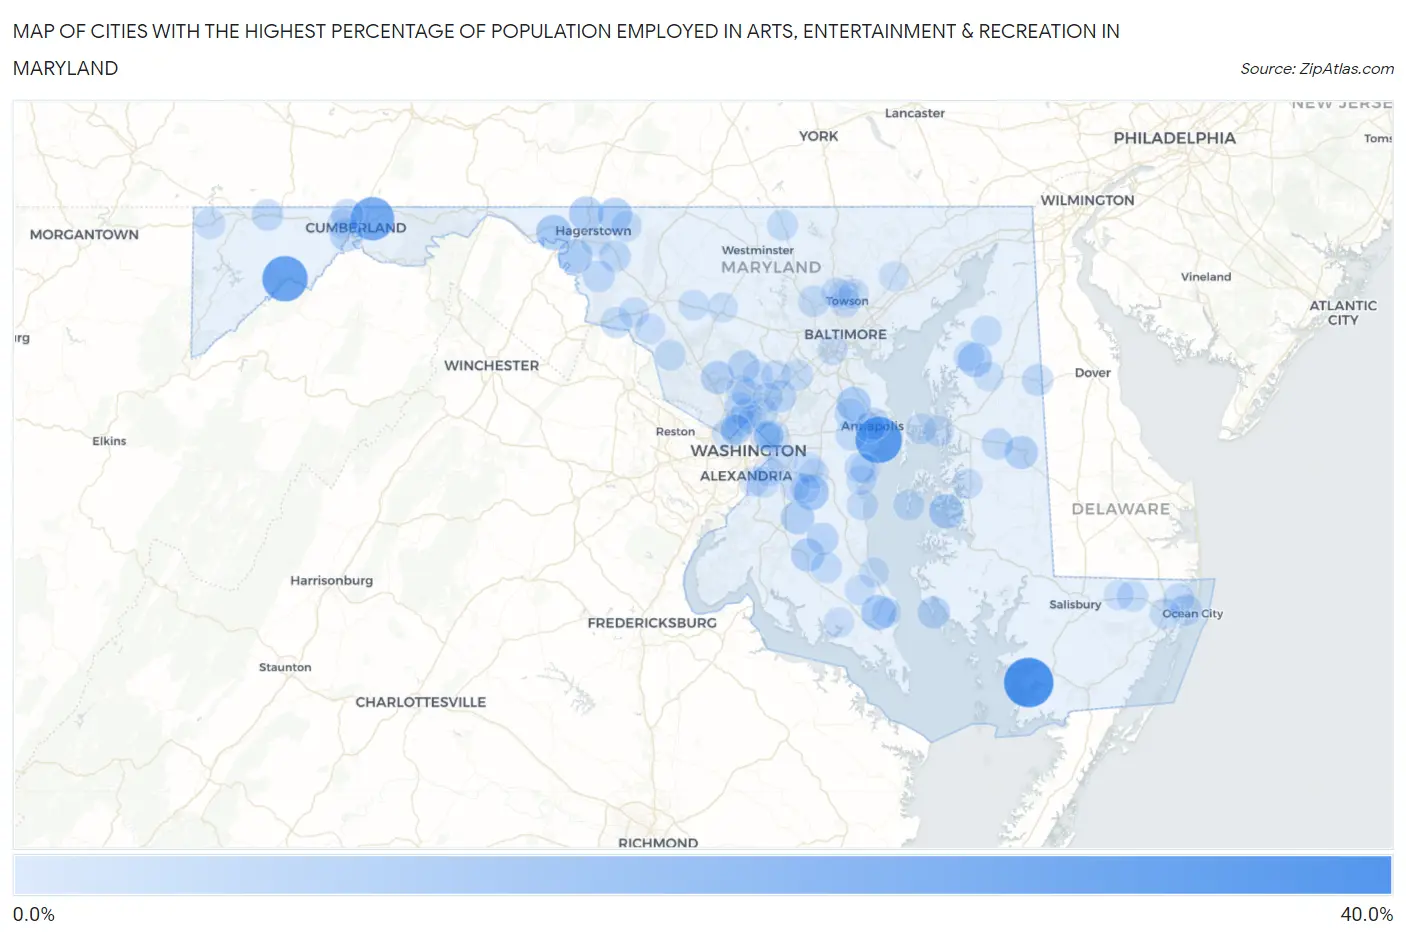
Map of Cities with the Highest Percentage of Population Employed in Arts, Entertainment & Recreation in Maryland
0.0%
40.0%
Cities with the Highest Percentage of Population Employed in Arts, Entertainment & Recreation in Maryland
| City | % Employed | vs State | vs National | |
| 1. | Fairmount | 34.4% | 1.9%(+32.5)#1 | 2.1%(+32.3)#100 |
| 2. | Highland Beach | 29.0% | 1.9%(+27.1)#2 | 2.1%(+26.9)#129 |
| 3. | Bloomington | 27.4% | 1.9%(+25.5)#3 | 2.1%(+25.3)#153 |
| 4. | Pleasant Grove | 24.3% | 1.9%(+22.4)#4 | 2.1%(+22.2)#197 |
| 5. | Cedar Heights | 12.4% | 1.9%(+10.5)#5 | 2.1%(+10.3)#639 |
| 6. | Charlton | 11.1% | 1.9%(+9.15)#6 | 2.1%(+8.98)#766 |
| 7. | Croom | 10.8% | 1.9%(+8.91)#7 | 2.1%(+8.74)#785 |
| 8. | Solomons | 10.7% | 1.9%(+8.79)#8 | 2.1%(+8.62)#802 |
| 9. | Downsville | 10.1% | 1.9%(+8.20)#9 | 2.1%(+8.03)#890 |
| 10. | Maugansville | 9.8% | 1.9%(+7.85)#10 | 2.1%(+7.67)#955 |
| 11. | Leitersburg | 9.7% | 1.9%(+7.82)#11 | 2.1%(+7.65)#959 |
| 12. | Oxford | 9.6% | 1.9%(+7.72)#12 | 2.1%(+7.55)#979 |
| 13. | Kingstown | 9.4% | 1.9%(+7.51)#13 | 2.1%(+7.34)#1,013 |
| 14. | Herald Harbor | 9.4% | 1.9%(+7.49)#14 | 2.1%(+7.32)#1,017 |
| 15. | Ten Mile Creek | 9.0% | 1.9%(+7.07)#15 | 2.1%(+6.90)#1,071 |
| 16. | Cedarville | 8.4% | 1.9%(+6.46)#16 | 2.1%(+6.29)#1,206 |
| 17. | West Denton | 8.2% | 1.9%(+6.25)#17 | 2.1%(+6.08)#1,258 |
| 18. | Hughesville | 8.1% | 1.9%(+6.14)#18 | 2.1%(+5.97)#1,284 |
| 19. | Washington Grove | 7.9% | 1.9%(+6.03)#19 | 2.1%(+5.85)#1,312 |
| 20. | Bowling Green | 7.4% | 1.9%(+5.46)#20 | 2.1%(+5.29)#1,496 |
| 21. | Konterra | 6.8% | 1.9%(+4.85)#21 | 2.1%(+4.68)#1,667 |
| 22. | Fishing Creek | 6.4% | 1.9%(+4.47)#22 | 2.1%(+4.30)#1,825 |
| 23. | Aquasco | 6.3% | 1.9%(+4.40)#23 | 2.1%(+4.23)#1,856 |
| 24. | Naval Academy | 6.2% | 1.9%(+4.31)#24 | 2.1%(+4.14)#1,891 |
| 25. | Corriganville | 6.1% | 1.9%(+4.15)#25 | 2.1%(+3.98)#1,945 |
| 26. | Brookeville | 6.1% | 1.9%(+4.15)#26 | 2.1%(+3.98)#1,950 |
| 27. | Keedysville | 5.6% | 1.9%(+3.72)#27 | 2.1%(+3.55)#2,191 |
| 28. | North Kensington | 5.6% | 1.9%(+3.69)#28 | 2.1%(+3.52)#2,207 |
| 29. | Mount Lena | 5.6% | 1.9%(+3.68)#29 | 2.1%(+3.50)#2,218 |
| 30. | Grantsville | 5.6% | 1.9%(+3.67)#30 | 2.1%(+3.50)#2,219 |
| 31. | Templeville | 5.6% | 1.9%(+3.64)#31 | 2.1%(+3.47)#2,238 |
| 32. | Hillsboro | 5.4% | 1.9%(+3.47)#32 | 2.1%(+3.29)#2,341 |
| 33. | West Ocean City | 5.2% | 1.9%(+3.30)#33 | 2.1%(+3.13)#2,447 |
| 34. | Brookmont | 5.1% | 1.9%(+3.21)#34 | 2.1%(+3.04)#2,510 |
| 35. | Garrison | 5.1% | 1.9%(+3.20)#35 | 2.1%(+3.03)#2,517 |
| 36. | Riva | 5.0% | 1.9%(+3.05)#36 | 2.1%(+2.88)#2,631 |
| 37. | Rosemont | 4.8% | 1.9%(+2.93)#37 | 2.1%(+2.76)#2,725 |
| 38. | Crownsville | 4.8% | 1.9%(+2.90)#38 | 2.1%(+2.73)#2,751 |
| 39. | Golden Beach | 4.8% | 1.9%(+2.87)#39 | 2.1%(+2.70)#2,763 |
| 40. | Tilghman Island | 4.7% | 1.9%(+2.79)#40 | 2.1%(+2.61)#2,834 |
| 41. | Savage | 4.7% | 1.9%(+2.78)#41 | 2.1%(+2.61)#2,839 |
| 42. | Kennedyville | 4.6% | 1.9%(+2.70)#42 | 2.1%(+2.53)#2,899 |
| 43. | Manchester | 4.6% | 1.9%(+2.65)#43 | 2.1%(+2.48)#2,953 |
| 44. | North Beach | 4.4% | 1.9%(+2.47)#44 | 2.1%(+2.30)#3,167 |
| 45. | Bladensburg | 4.4% | 1.9%(+2.45)#45 | 2.1%(+2.28)#3,185 |
| 46. | Willards | 4.3% | 1.9%(+2.43)#46 | 2.1%(+2.26)#3,222 |
| 47. | Galesville | 4.3% | 1.9%(+2.41)#47 | 2.1%(+2.23)#3,242 |
| 48. | Chestertown | 4.3% | 1.9%(+2.39)#48 | 2.1%(+2.22)#3,264 |
| 49. | Ocean Pines | 4.3% | 1.9%(+2.39)#49 | 2.1%(+2.22)#3,266 |
| 50. | Grasonville | 4.2% | 1.9%(+2.30)#50 | 2.1%(+2.13)#3,360 |
| 51. | Green Valley | 4.2% | 1.9%(+2.29)#51 | 2.1%(+2.11)#3,381 |
| 52. | Hillandale | 4.1% | 1.9%(+2.23)#52 | 2.1%(+2.06)#3,451 |
| 53. | Smithsburg | 4.1% | 1.9%(+2.23)#53 | 2.1%(+2.06)#3,452 |
| 54. | Berlin | 4.1% | 1.9%(+2.23)#54 | 2.1%(+2.06)#3,460 |
| 55. | La Vale | 4.1% | 1.9%(+2.23)#55 | 2.1%(+2.05)#3,462 |
| 56. | Chester | 4.1% | 1.9%(+2.21)#56 | 2.1%(+2.04)#3,485 |
| 57. | Chevy Chase | 4.1% | 1.9%(+2.21)#57 | 2.1%(+2.04)#3,499 |
| 58. | Forest Glen | 4.1% | 1.9%(+2.20)#58 | 2.1%(+2.03)#3,517 |
| 59. | Friendsville | 4.1% | 1.9%(+2.19)#59 | 2.1%(+2.02)#3,523 |
| 60. | Barnesville | 4.1% | 1.9%(+2.14)#60 | 2.1%(+1.97)#3,573 |
| 61. | Broomes Island | 4.0% | 1.9%(+2.08)#61 | 2.1%(+1.91)#3,651 |
| 62. | Mount Rainier | 3.9% | 1.9%(+1.99)#62 | 2.1%(+1.82)#3,761 |
| 63. | New Market | 3.9% | 1.9%(+1.97)#63 | 2.1%(+1.80)#3,781 |
| 64. | Oxon Hill | 3.8% | 1.9%(+1.89)#64 | 2.1%(+1.72)#3,895 |
| 65. | Somerset | 3.8% | 1.9%(+1.85)#65 | 2.1%(+1.68)#3,955 |
| 66. | Friendship Heights Village | 3.7% | 1.9%(+1.84)#66 | 2.1%(+1.67)#3,981 |
| 67. | Jefferson | 3.7% | 1.9%(+1.83)#67 | 2.1%(+1.65)#4,003 |
| 68. | Lutherville | 3.7% | 1.9%(+1.78)#68 | 2.1%(+1.61)#4,087 |
| 69. | Easton | 3.7% | 1.9%(+1.76)#69 | 2.1%(+1.59)#4,123 |
| 70. | Layhill | 3.7% | 1.9%(+1.75)#70 | 2.1%(+1.57)#4,137 |
| 71. | Towson | 3.6% | 1.9%(+1.73)#71 | 2.1%(+1.55)#4,154 |
| 72. | Annapolis | 3.6% | 1.9%(+1.68)#72 | 2.1%(+1.51)#4,226 |
| 73. | Marlow Heights | 3.6% | 1.9%(+1.68)#73 | 2.1%(+1.50)#4,233 |
| 74. | Hampton | 3.6% | 1.9%(+1.67)#74 | 2.1%(+1.50)#4,239 |
| 75. | Leonardtown | 3.6% | 1.9%(+1.64)#75 | 2.1%(+1.47)#4,299 |
| 76. | Marlboro Village | 3.5% | 1.9%(+1.63)#76 | 2.1%(+1.46)#4,311 |
| 77. | National Harbor | 3.5% | 1.9%(+1.63)#77 | 2.1%(+1.45)#4,325 |
| 78. | Leisure World | 3.5% | 1.9%(+1.62)#78 | 2.1%(+1.45)#4,346 |
| 79. | Adamstown | 3.4% | 1.9%(+1.51)#79 | 2.1%(+1.33)#4,555 |
| 80. | Lansdowne | 3.4% | 1.9%(+1.50)#80 | 2.1%(+1.33)#4,561 |
| 81. | Mays Chapel | 3.4% | 1.9%(+1.50)#81 | 2.1%(+1.33)#4,577 |
| 82. | District Heights | 3.4% | 1.9%(+1.49)#82 | 2.1%(+1.32)#4,586 |
| 83. | Ashton Sandy Spring | 3.4% | 1.9%(+1.44)#83 | 2.1%(+1.27)#4,678 |
| 84. | Calvert Beach | 3.4% | 1.9%(+1.44)#84 | 2.1%(+1.27)#4,680 |
| 85. | Church Hill | 3.3% | 1.9%(+1.42)#85 | 2.1%(+1.24)#4,733 |
| 86. | Fulton | 3.3% | 1.9%(+1.41)#86 | 2.1%(+1.24)#4,747 |
| 87. | Rosaryville | 3.3% | 1.9%(+1.36)#87 | 2.1%(+1.19)#4,835 |
| 88. | Mount Airy | 3.3% | 1.9%(+1.36)#88 | 2.1%(+1.19)#4,843 |
| 89. | Fairland | 3.3% | 1.9%(+1.34)#89 | 2.1%(+1.17)#4,869 |
| 90. | Marlton | 3.3% | 1.9%(+1.34)#90 | 2.1%(+1.17)#4,875 |
| 91. | Deale | 3.2% | 1.9%(+1.30)#91 | 2.1%(+1.12)#4,952 |
| 92. | Shady Side | 3.2% | 1.9%(+1.29)#92 | 2.1%(+1.12)#4,958 |
| 93. | Pleasant Hills | 3.2% | 1.9%(+1.28)#93 | 2.1%(+1.11)#4,975 |
| 94. | Drum Point | 3.2% | 1.9%(+1.28)#94 | 2.1%(+1.11)#4,984 |
| 95. | Upper Marlboro | 3.1% | 1.9%(+1.18)#95 | 2.1%(+1.01)#5,196 |
| 96. | Funkstown | 3.0% | 1.9%(+1.11)#96 | 2.1%(+0.941)#5,347 |
| 97. | Silver Spring | 3.0% | 1.9%(+1.08)#97 | 2.1%(+0.910)#5,407 |
| 98. | Pittsville | 3.0% | 1.9%(+1.08)#98 | 2.1%(+0.908)#5,411 |
| 99. | Cottage City | 3.0% | 1.9%(+1.06)#99 | 2.1%(+0.888)#5,456 |
| 100. | North Brentwood | 2.9% | 1.9%(+1.03)#100 | 2.1%(+0.859)#5,529 |
Common Questions
What are the Top 10 Cities with the Highest Percentage of Population Employed in Arts, Entertainment & Recreation in Maryland?
Top 10 Cities with the Highest Percentage of Population Employed in Arts, Entertainment & Recreation in Maryland are:
#1
34.4%
#2
29.0%
#3
27.4%
#4
24.3%
#5
11.1%
#6
10.8%
#7
10.7%
#8
10.1%
#9
9.8%
#10
9.7%
What city has the Highest Percentage of Population Employed in Arts, Entertainment & Recreation in Maryland?
Fairmount has the Highest Percentage of Population Employed in Arts, Entertainment & Recreation in Maryland with 34.4%.
What is the Percentage of Population Employed in Arts, Entertainment & Recreation in the State of Maryland?
Percentage of Population Employed in Arts, Entertainment & Recreation in Maryland is 1.9%.
What is the Percentage of Population Employed in Arts, Entertainment & Recreation in the United States?
Percentage of Population Employed in Arts, Entertainment & Recreation in the United States is 2.1%.