Zip Codes with the Highest Percentage of Population Employed in Arts, Entertainment & Recreation in Edmonds, WA
RELATED REPORTS & OPTIONS
Arts, Entertainment & Recreation
Edmonds
Compare Zip Codes
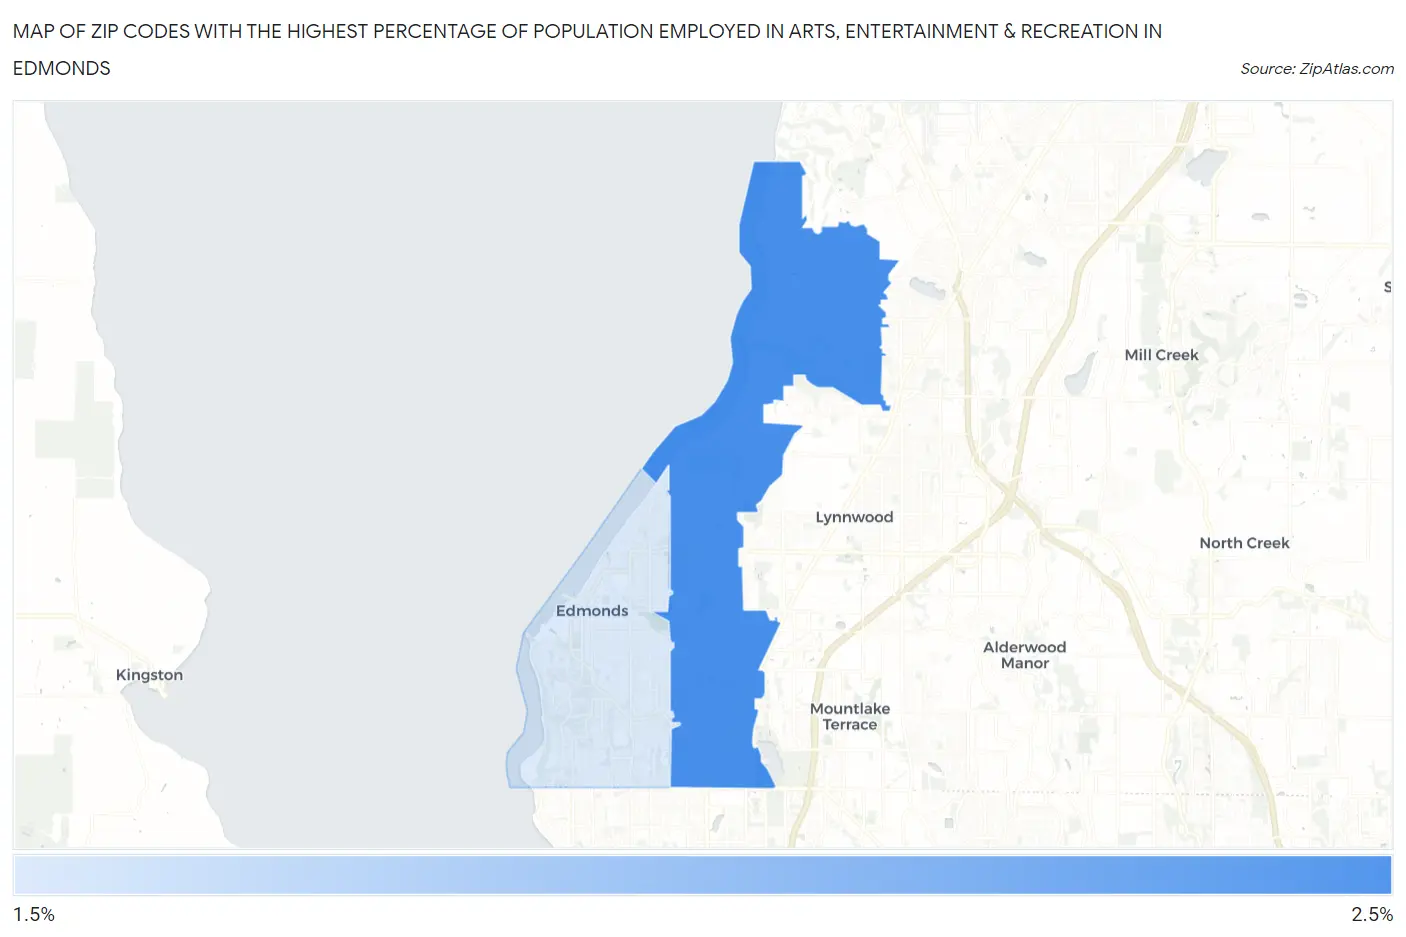
Map of Zip Codes with the Highest Percentage of Population Employed in Arts, Entertainment & Recreation in Edmonds
1.8%
2.5%
Zip Codes with the Highest Percentage of Population Employed in Arts, Entertainment & Recreation in Edmonds, WA
| Zip Code | % Employed | vs State | vs National | |
| 1. | 98026 | 2.5% | 2.1%(+0.307)#189 | 2.1%(+0.371)#7,396 |
| 2. | 98020 | 1.8% | 2.1%(-0.358)#274 | 2.1%(-0.294)#11,089 |
1
Common Questions
What are the Top Zip Codes with the Highest Percentage of Population Employed in Arts, Entertainment & Recreation in Edmonds, WA?
Top Zip Codes with the Highest Percentage of Population Employed in Arts, Entertainment & Recreation in Edmonds, WA are:
What zip code has the Highest Percentage of Population Employed in Arts, Entertainment & Recreation in Edmonds, WA?
98026 has the Highest Percentage of Population Employed in Arts, Entertainment & Recreation in Edmonds, WA with 2.5%.
What is the Percentage of Population Employed in Arts, Entertainment & Recreation in Edmonds, WA?
Percentage of Population Employed in Arts, Entertainment & Recreation in Edmonds is 2.7%.
What is the Percentage of Population Employed in Arts, Entertainment & Recreation in Washington?
Percentage of Population Employed in Arts, Entertainment & Recreation in Washington is 2.1%.
What is the Percentage of Population Employed in Arts, Entertainment & Recreation in the United States?
Percentage of Population Employed in Arts, Entertainment & Recreation in the United States is 2.1%.