Cities with the Highest Percentage of Population Employed in Arts, Entertainment & Recreation in North Carolina
RELATED REPORTS & OPTIONS
Arts, Entertainment & Recreation
North Carolina
Compare Cities
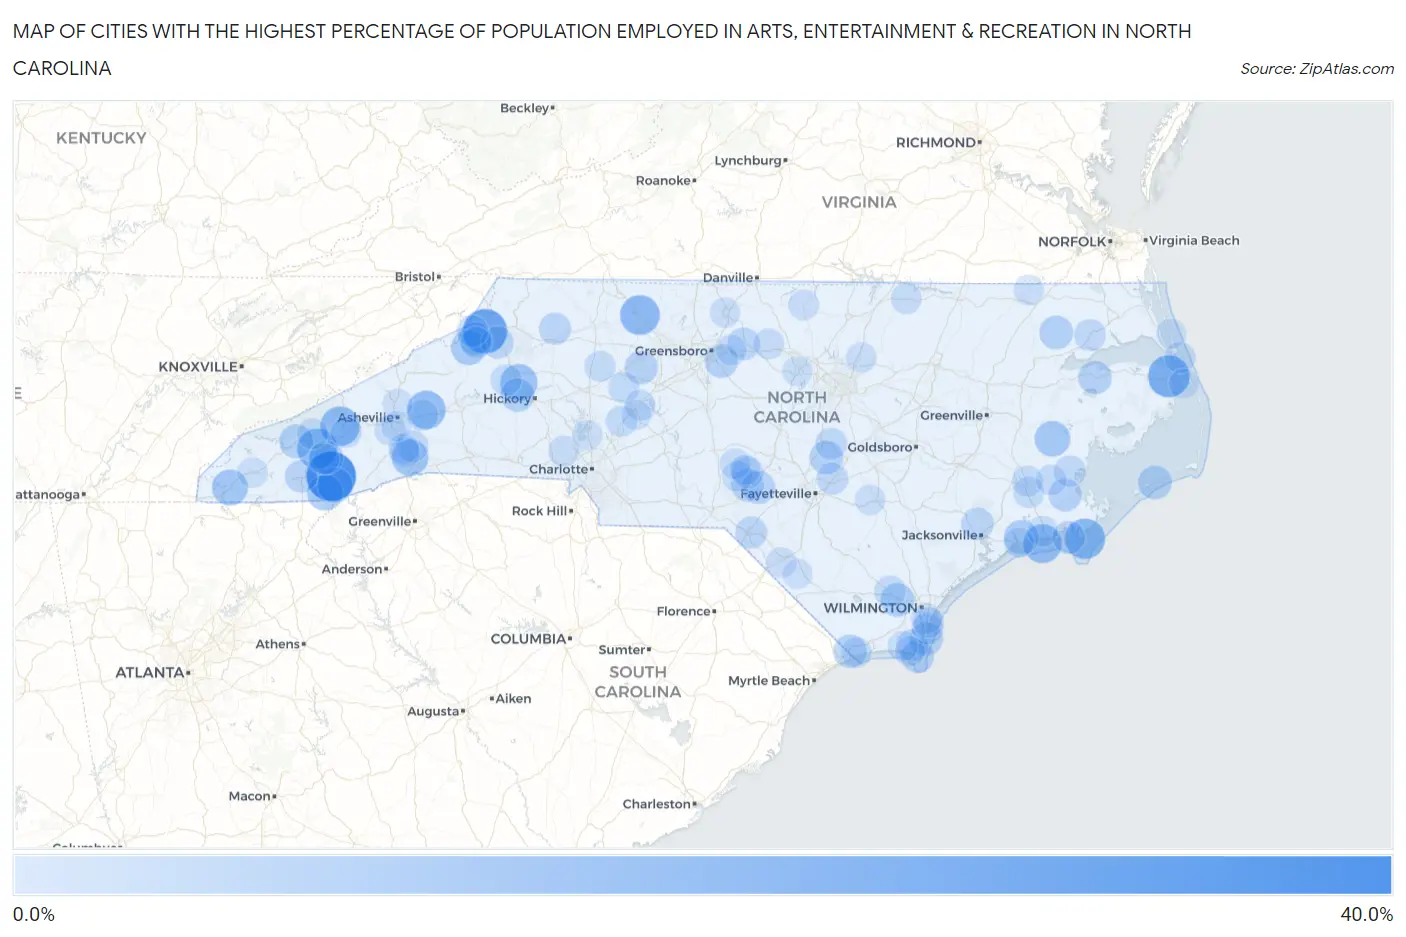
Map of Cities with the Highest Percentage of Population Employed in Arts, Entertainment & Recreation in North Carolina
0.0%
40.0%
Cities with the Highest Percentage of Population Employed in Arts, Entertainment & Recreation in North Carolina
| City | % Employed | vs State | vs National | |
| 1. | Glenville | 30.1% | 1.8%(+28.4)#1 | 2.1%(+28.1)#121 |
| 2. | Valle Crucis | 23.1% | 1.8%(+21.3)#2 | 2.1%(+21.0)#212 |
| 3. | Alexis | 20.4% | 1.8%(+18.6)#3 | 2.1%(+18.3)#263 |
| 4. | Manns Harbor | 19.7% | 1.8%(+17.9)#4 | 2.1%(+17.6)#276 |
| 5. | Dillsboro | 17.5% | 1.8%(+15.7)#5 | 2.1%(+15.4)#343 |
| 6. | Marshallberg | 17.5% | 1.8%(+15.7)#6 | 2.1%(+15.4)#344 |
| 7. | Pinnacle | 16.5% | 1.8%(+14.8)#7 | 2.1%(+14.4)#388 |
| 8. | Maggie Valley | 16.2% | 1.8%(+14.5)#8 | 2.1%(+14.1)#400 |
| 9. | Indian Beach | 15.1% | 1.8%(+13.3)#9 | 2.1%(+13.0)#462 |
| 10. | Montreat | 15.0% | 1.8%(+13.2)#10 | 2.1%(+12.9)#469 |
| 11. | Hudson | 13.2% | 1.8%(+11.4)#11 | 2.1%(+11.1)#587 |
| 12. | Barker Heights | 12.5% | 1.8%(+10.8)#12 | 2.1%(+10.5)#621 |
| 13. | Murphy | 11.6% | 1.8%(+9.83)#13 | 2.1%(+9.50)#707 |
| 14. | Highlands | 11.3% | 1.8%(+9.57)#14 | 2.1%(+9.24)#734 |
| 15. | Bayview | 11.1% | 1.8%(+9.36)#15 | 2.1%(+9.03)#753 |
| 16. | Cashiers | 10.6% | 1.8%(+8.87)#16 | 2.1%(+8.54)#811 |
| 17. | Newland | 10.5% | 1.8%(+8.79)#17 | 2.1%(+8.46)#823 |
| 18. | Peletier | 10.0% | 1.8%(+8.25)#18 | 2.1%(+7.92)#903 |
| 19. | Bryson City | 8.9% | 1.8%(+7.11)#19 | 2.1%(+6.78)#1,092 |
| 20. | Cullowhee | 8.8% | 1.8%(+7.08)#20 | 2.1%(+6.75)#1,094 |
| 21. | Ocracoke | 8.8% | 1.8%(+7.05)#21 | 2.1%(+6.72)#1,102 |
| 22. | Colerain | 8.7% | 1.8%(+6.94)#22 | 2.1%(+6.61)#1,127 |
| 23. | Connelly Springs | 8.7% | 1.8%(+6.93)#23 | 2.1%(+6.60)#1,138 |
| 24. | Sandy Creek | 8.5% | 1.8%(+6.72)#24 | 2.1%(+6.39)#1,191 |
| 25. | Bunnlevel | 8.3% | 1.8%(+6.56)#25 | 2.1%(+6.24)#1,222 |
| 26. | Carolina Shores | 8.1% | 1.8%(+6.39)#26 | 2.1%(+6.06)#1,261 |
| 27. | Kure Beach | 8.1% | 1.8%(+6.32)#27 | 2.1%(+5.99)#1,277 |
| 28. | Creswell | 8.1% | 1.8%(+6.31)#28 | 2.1%(+5.98)#1,280 |
| 29. | Forest Oaks | 8.0% | 1.8%(+6.29)#29 | 2.1%(+5.96)#1,286 |
| 30. | Banner Elk | 8.0% | 1.8%(+6.26)#30 | 2.1%(+5.94)#1,291 |
| 31. | Advance | 7.9% | 1.8%(+6.12)#31 | 2.1%(+5.79)#1,330 |
| 32. | Ashley Heights | 7.7% | 1.8%(+5.94)#32 | 2.1%(+5.61)#1,386 |
| 33. | Bald Head Island | 7.7% | 1.8%(+5.94)#33 | 2.1%(+5.61)#1,393 |
| 34. | Oriental | 7.6% | 1.8%(+5.84)#34 | 2.1%(+5.51)#1,424 |
| 35. | Beaufort | 7.5% | 1.8%(+5.70)#35 | 2.1%(+5.37)#1,472 |
| 36. | Pinebluff | 7.4% | 1.8%(+5.65)#36 | 2.1%(+5.32)#1,489 |
| 37. | Franklin | 7.2% | 1.8%(+5.45)#37 | 2.1%(+5.12)#1,537 |
| 38. | Elon | 7.1% | 1.8%(+5.36)#38 | 2.1%(+5.03)#1,561 |
| 39. | Blowing Rock | 7.0% | 1.8%(+5.22)#39 | 2.1%(+4.89)#1,604 |
| 40. | Half Moon | 6.9% | 1.8%(+5.14)#40 | 2.1%(+4.81)#1,631 |
| 41. | Mulberry | 6.6% | 1.8%(+4.89)#41 | 2.1%(+4.56)#1,709 |
| 42. | East Laurinburg | 6.5% | 1.8%(+4.70)#42 | 2.1%(+4.37)#1,793 |
| 43. | Southport | 6.3% | 1.8%(+4.58)#43 | 2.1%(+4.25)#1,846 |
| 44. | Pinehurst | 6.2% | 1.8%(+4.47)#44 | 2.1%(+4.14)#1,890 |
| 45. | Buies Creek | 6.2% | 1.8%(+4.46)#45 | 2.1%(+4.13)#1,896 |
| 46. | Fruitland | 6.2% | 1.8%(+4.41)#46 | 2.1%(+4.09)#1,912 |
| 47. | Hertford | 6.0% | 1.8%(+4.27)#47 | 2.1%(+3.94)#1,963 |
| 48. | Mesic | 6.0% | 1.8%(+4.22)#48 | 2.1%(+3.89)#1,992 |
| 49. | Sea Breeze | 6.0% | 1.8%(+4.20)#49 | 2.1%(+3.87)#2,003 |
| 50. | Wade | 5.9% | 1.8%(+4.19)#50 | 2.1%(+3.86)#2,011 |
| 51. | Beech Mountain | 5.8% | 1.8%(+4.09)#51 | 2.1%(+3.76)#2,065 |
| 52. | Sugar Mountain | 5.7% | 1.8%(+3.92)#52 | 2.1%(+3.59)#2,157 |
| 53. | Riegelwood | 5.6% | 1.8%(+3.89)#53 | 2.1%(+3.57)#2,176 |
| 54. | Black Mountain | 5.4% | 1.8%(+3.69)#54 | 2.1%(+3.36)#2,300 |
| 55. | Cooleemee | 5.4% | 1.8%(+3.62)#55 | 2.1%(+3.29)#2,342 |
| 56. | Gamewell | 5.3% | 1.8%(+3.55)#56 | 2.1%(+3.23)#2,377 |
| 57. | Brandywine Bay | 5.3% | 1.8%(+3.55)#57 | 2.1%(+3.23)#2,378 |
| 58. | Forest Hills | 5.3% | 1.8%(+3.55)#58 | 2.1%(+3.22)#2,382 |
| 59. | China Grove | 5.3% | 1.8%(+3.53)#59 | 2.1%(+3.20)#2,390 |
| 60. | James City | 5.2% | 1.8%(+3.50)#60 | 2.1%(+3.17)#2,418 |
| 61. | Kill Devil Hills | 5.2% | 1.8%(+3.49)#61 | 2.1%(+3.16)#2,420 |
| 62. | Bridgeton | 5.2% | 1.8%(+3.48)#62 | 2.1%(+3.15)#2,431 |
| 63. | Waynesville | 5.1% | 1.8%(+3.32)#63 | 2.1%(+2.99)#2,549 |
| 64. | Harmony | 5.0% | 1.8%(+3.28)#64 | 2.1%(+2.95)#2,574 |
| 65. | Cherokee | 5.0% | 1.8%(+3.26)#65 | 2.1%(+2.93)#2,587 |
| 66. | Bent Creek | 5.0% | 1.8%(+3.26)#66 | 2.1%(+2.93)#2,588 |
| 67. | Dudley | 5.0% | 1.8%(+3.20)#67 | 2.1%(+2.87)#2,641 |
| 68. | Foxfire | 4.8% | 1.8%(+3.08)#68 | 2.1%(+2.75)#2,729 |
| 69. | Stanley | 4.8% | 1.8%(+3.06)#69 | 2.1%(+2.73)#2,750 |
| 70. | Sedalia | 4.8% | 1.8%(+3.03)#70 | 2.1%(+2.70)#2,769 |
| 71. | Macon | 4.8% | 1.8%(+3.01)#71 | 2.1%(+2.68)#2,791 |
| 72. | East Spencer | 4.7% | 1.8%(+2.98)#72 | 2.1%(+2.66)#2,809 |
| 73. | Woodlawn | 4.7% | 1.8%(+2.94)#73 | 2.1%(+2.61)#2,835 |
| 74. | Sunset Beach | 4.7% | 1.8%(+2.94)#74 | 2.1%(+2.61)#2,838 |
| 75. | Silver Lake | 4.6% | 1.8%(+2.88)#75 | 2.1%(+2.55)#2,883 |
| 76. | Myrtle Grove | 4.6% | 1.8%(+2.82)#76 | 2.1%(+2.49)#2,940 |
| 77. | Alliance | 4.6% | 1.8%(+2.81)#77 | 2.1%(+2.48)#2,954 |
| 78. | Newport | 4.5% | 1.8%(+2.78)#78 | 2.1%(+2.46)#2,988 |
| 79. | Seven Lakes | 4.5% | 1.8%(+2.78)#79 | 2.1%(+2.46)#2,989 |
| 80. | Mountain Home | 4.5% | 1.8%(+2.75)#80 | 2.1%(+2.42)#3,031 |
| 81. | Balfour | 4.5% | 1.8%(+2.73)#81 | 2.1%(+2.41)#3,047 |
| 82. | Andrews | 4.5% | 1.8%(+2.71)#82 | 2.1%(+2.39)#3,072 |
| 83. | Mcdonald | 4.4% | 1.8%(+2.69)#83 | 2.1%(+2.36)#3,103 |
| 84. | Roxboro | 4.4% | 1.8%(+2.67)#84 | 2.1%(+2.34)#3,129 |
| 85. | Bonnetsville | 4.4% | 1.8%(+2.64)#85 | 2.1%(+2.31)#3,155 |
| 86. | Taylortown | 4.3% | 1.8%(+2.59)#86 | 2.1%(+2.27)#3,204 |
| 87. | Como | 4.3% | 1.8%(+2.59)#87 | 2.1%(+2.27)#3,215 |
| 88. | Youngsville | 4.2% | 1.8%(+2.42)#88 | 2.1%(+2.10)#3,397 |
| 89. | Reidsville | 4.2% | 1.8%(+2.41)#89 | 2.1%(+2.08)#3,426 |
| 90. | St James | 4.1% | 1.8%(+2.39)#90 | 2.1%(+2.07)#3,444 |
| 91. | Chapel Hill | 4.1% | 1.8%(+2.37)#91 | 2.1%(+2.05)#3,479 |
| 92. | Cedar Point | 4.1% | 1.8%(+2.30)#92 | 2.1%(+1.97)#3,578 |
| 93. | Granite Quarry | 4.0% | 1.8%(+2.29)#93 | 2.1%(+1.96)#3,583 |
| 94. | Caswell Beach | 4.0% | 1.8%(+2.26)#94 | 2.1%(+1.94)#3,609 |
| 95. | Asheville | 4.0% | 1.8%(+2.21)#95 | 2.1%(+1.88)#3,683 |
| 96. | Wanchese | 4.0% | 1.8%(+2.20)#96 | 2.1%(+1.87)#3,695 |
| 97. | Weaverville | 3.9% | 1.8%(+2.18)#97 | 2.1%(+1.85)#3,720 |
| 98. | Cornelius | 3.9% | 1.8%(+2.16)#98 | 2.1%(+1.83)#3,743 |
| 99. | Duck | 3.9% | 1.8%(+2.12)#99 | 2.1%(+1.79)#3,795 |
| 100. | Proctorville | 3.8% | 1.8%(+2.09)#100 | 2.1%(+1.76)#3,835 |
Common Questions
What are the Top 10 Cities with the Highest Percentage of Population Employed in Arts, Entertainment & Recreation in North Carolina?
Top 10 Cities with the Highest Percentage of Population Employed in Arts, Entertainment & Recreation in North Carolina are:
#1
30.1%
#2
23.1%
#3
19.7%
#4
17.5%
#5
17.5%
#6
16.5%
#7
16.2%
#8
15.1%
#9
15.0%
#10
13.2%
What city has the Highest Percentage of Population Employed in Arts, Entertainment & Recreation in North Carolina?
Glenville has the Highest Percentage of Population Employed in Arts, Entertainment & Recreation in North Carolina with 30.1%.
What is the Percentage of Population Employed in Arts, Entertainment & Recreation in the State of North Carolina?
Percentage of Population Employed in Arts, Entertainment & Recreation in North Carolina is 1.8%.
What is the Percentage of Population Employed in Arts, Entertainment & Recreation in the United States?
Percentage of Population Employed in Arts, Entertainment & Recreation in the United States is 2.1%.