Cities with the Highest Percentage of Population Employed in Arts, Entertainment & Recreation in Missouri
RELATED REPORTS & OPTIONS
Arts, Entertainment & Recreation
Missouri
Compare Cities
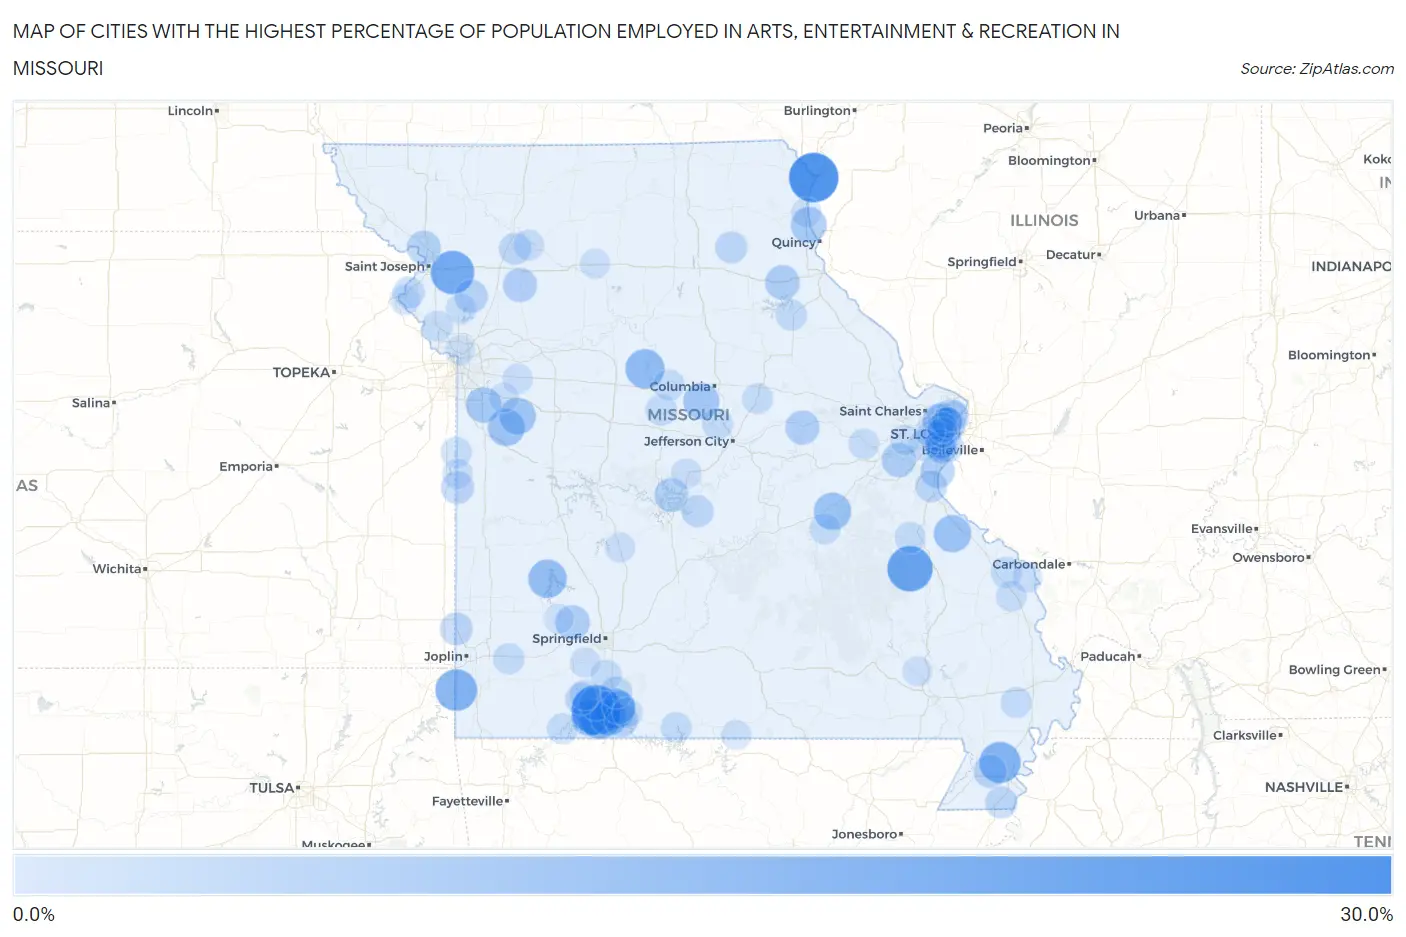
Map of Cities with the Highest Percentage of Population Employed in Arts, Entertainment & Recreation in Missouri
0.0%
30.0%
Cities with the Highest Percentage of Population Employed in Arts, Entertainment & Recreation in Missouri
| City | % Employed | vs State | vs National | |
| 1. | Branson West | 25.2% | 1.8%(+23.3)#1 | 2.1%(+23.1)#177 |
| 2. | Alexandria | 25.0% | 1.8%(+23.2)#2 | 2.1%(+22.9)#180 |
| 3. | Iron Mountain Lake | 20.4% | 1.8%(+18.5)#3 | 2.1%(+18.3)#262 |
| 4. | Easton | 18.3% | 1.8%(+16.4)#4 | 2.1%(+16.2)#313 |
| 5. | Seneca | 16.1% | 1.8%(+14.3)#5 | 2.1%(+14.0)#406 |
| 6. | Homestown | 15.7% | 1.8%(+13.9)#6 | 2.1%(+13.6)#428 |
| 7. | Goose Creek Lake | 14.9% | 1.8%(+13.1)#7 | 2.1%(+12.9)#471 |
| 8. | Indian Point | 14.5% | 1.8%(+12.7)#8 | 2.1%(+12.5)#489 |
| 9. | Bull Creek | 14.5% | 1.8%(+12.6)#9 | 2.1%(+12.4)#491 |
| 10. | Arrow Rock | 13.3% | 1.8%(+11.5)#10 | 2.1%(+11.3)#572 |
| 11. | Umber View Heights | 12.5% | 1.8%(+10.7)#11 | 2.1%(+10.4)#631 |
| 12. | Leasburg | 11.3% | 1.8%(+9.49)#12 | 2.1%(+9.24)#735 |
| 13. | Grayhawk | 11.2% | 1.8%(+9.41)#13 | 2.1%(+9.16)#743 |
| 14. | Kimberling City | 11.1% | 1.8%(+9.22)#14 | 2.1%(+8.97)#767 |
| 15. | Gunn City | 10.9% | 1.8%(+9.04)#15 | 2.1%(+8.79)#782 |
| 16. | Kingsville | 10.6% | 1.8%(+8.79)#16 | 2.1%(+8.54)#812 |
| 17. | Blue Summit | 10.5% | 1.8%(+8.64)#17 | 2.1%(+8.39)#834 |
| 18. | Branson | 10.2% | 1.8%(+8.39)#18 | 2.1%(+8.14)#874 |
| 19. | Lupus | 10.0% | 1.8%(+8.17)#19 | 2.1%(+7.92)#914 |
| 20. | La Grange | 9.7% | 1.8%(+7.84)#20 | 2.1%(+7.59)#967 |
| 21. | Lake Winnebago | 9.4% | 1.8%(+7.56)#21 | 2.1%(+7.31)#1,020 |
| 22. | Hillsdale | 9.2% | 1.8%(+7.38)#22 | 2.1%(+7.14)#1,038 |
| 23. | Monroe City | 8.4% | 1.8%(+6.52)#23 | 2.1%(+6.27)#1,209 |
| 24. | Ash Grove | 8.2% | 1.8%(+6.37)#24 | 2.1%(+6.12)#1,244 |
| 25. | Lake Tekakwitha | 8.1% | 1.8%(+6.24)#25 | 2.1%(+5.99)#1,279 |
| 26. | Imperial | 7.8% | 1.8%(+5.92)#26 | 2.1%(+5.67)#1,366 |
| 27. | Kingston | 7.7% | 1.8%(+5.86)#27 | 2.1%(+5.61)#1,388 |
| 28. | Gasconade | 7.6% | 1.8%(+5.81)#28 | 2.1%(+5.56)#1,412 |
| 29. | Amazonia | 7.5% | 1.8%(+5.69)#29 | 2.1%(+5.44)#1,453 |
| 30. | Village Of Four Seasons | 7.4% | 1.8%(+5.57)#30 | 2.1%(+5.32)#1,488 |
| 31. | Reeds Spring | 7.3% | 1.8%(+5.44)#31 | 2.1%(+5.19)#1,515 |
| 32. | Kirbyville | 7.1% | 1.8%(+5.31)#32 | 2.1%(+5.06)#1,555 |
| 33. | Plattsburg | 6.8% | 1.8%(+4.95)#33 | 2.1%(+4.70)#1,660 |
| 34. | Bragg City | 6.7% | 1.8%(+4.83)#34 | 2.1%(+4.58)#1,701 |
| 35. | Merriam Woods | 6.4% | 1.8%(+4.57)#35 | 2.1%(+4.32)#1,814 |
| 36. | Asbury | 6.2% | 1.8%(+4.42)#36 | 2.1%(+4.17)#1,876 |
| 37. | Amoret | 6.2% | 1.8%(+4.34)#37 | 2.1%(+4.09)#1,910 |
| 38. | Lakeshire | 6.1% | 1.8%(+4.29)#38 | 2.1%(+4.05)#1,928 |
| 39. | St John | 6.0% | 1.8%(+4.20)#39 | 2.1%(+3.95)#1,960 |
| 40. | Cooter | 5.6% | 1.8%(+3.72)#40 | 2.1%(+3.47)#2,234 |
| 41. | Mccord Bend | 5.6% | 1.8%(+3.72)#41 | 2.1%(+3.47)#2,235 |
| 42. | Altamont | 5.6% | 1.8%(+3.72)#42 | 2.1%(+3.47)#2,240 |
| 43. | Leonard | 5.6% | 1.8%(+3.72)#43 | 2.1%(+3.47)#2,243 |
| 44. | Breckenridge Hills | 5.5% | 1.8%(+3.71)#44 | 2.1%(+3.46)#2,249 |
| 45. | Bella Villa | 5.5% | 1.8%(+3.69)#45 | 2.1%(+3.45)#2,254 |
| 46. | Castle Point | 5.4% | 1.8%(+3.60)#46 | 2.1%(+3.35)#2,309 |
| 47. | Brumley | 5.4% | 1.8%(+3.57)#47 | 2.1%(+3.32)#2,325 |
| 48. | Horine | 5.4% | 1.8%(+3.56)#48 | 2.1%(+3.31)#2,334 |
| 49. | Saddlebrooke | 5.4% | 1.8%(+3.52)#49 | 2.1%(+3.27)#2,350 |
| 50. | Marlborough | 5.3% | 1.8%(+3.51)#50 | 2.1%(+3.27)#2,354 |
| 51. | Rushville | 5.1% | 1.8%(+3.29)#51 | 2.1%(+3.05)#2,505 |
| 52. | Huntleigh | 5.1% | 1.8%(+3.27)#52 | 2.1%(+3.02)#2,524 |
| 53. | Bunceton | 4.8% | 1.8%(+2.99)#53 | 2.1%(+2.74)#2,743 |
| 54. | Perry | 4.8% | 1.8%(+2.93)#54 | 2.1%(+2.68)#2,782 |
| 55. | Terre Du Lac | 4.7% | 1.8%(+2.86)#55 | 2.1%(+2.61)#2,832 |
| 56. | Sarcoxie | 4.7% | 1.8%(+2.84)#56 | 2.1%(+2.59)#2,847 |
| 57. | Hartsburg | 4.7% | 1.8%(+2.82)#57 | 2.1%(+2.57)#2,867 |
| 58. | Longtown | 4.6% | 1.8%(+2.78)#58 | 2.1%(+2.53)#2,906 |
| 59. | Valley Park | 4.6% | 1.8%(+2.75)#59 | 2.1%(+2.50)#2,932 |
| 60. | Boonville | 4.5% | 1.8%(+2.71)#60 | 2.1%(+2.46)#2,984 |
| 61. | Emerald Beach | 4.5% | 1.8%(+2.66)#61 | 2.1%(+2.41)#3,041 |
| 62. | Drexel | 4.5% | 1.8%(+2.66)#62 | 2.1%(+2.41)#3,044 |
| 63. | Canalou | 4.5% | 1.8%(+2.64)#63 | 2.1%(+2.40)#3,062 |
| 64. | Glen Echo Park | 4.4% | 1.8%(+2.61)#64 | 2.1%(+2.36)#3,104 |
| 65. | Theodosia | 4.3% | 1.8%(+2.51)#65 | 2.1%(+2.27)#3,214 |
| 66. | Steelville | 4.3% | 1.8%(+2.51)#66 | 2.1%(+2.26)#3,223 |
| 67. | Fulton | 4.3% | 1.8%(+2.50)#67 | 2.1%(+2.25)#3,232 |
| 68. | Highlandville | 4.3% | 1.8%(+2.49)#68 | 2.1%(+2.24)#3,235 |
| 69. | Washington | 4.2% | 1.8%(+2.35)#69 | 2.1%(+2.11)#3,388 |
| 70. | Gallatin | 4.1% | 1.8%(+2.31)#70 | 2.1%(+2.06)#3,446 |
| 71. | Platte City | 4.1% | 1.8%(+2.28)#71 | 2.1%(+2.04)#3,500 |
| 72. | Rock Hill | 4.1% | 1.8%(+2.27)#72 | 2.1%(+2.02)#3,524 |
| 73. | Galena | 4.1% | 1.8%(+2.22)#73 | 2.1%(+1.97)#3,571 |
| 74. | Kinloch | 4.0% | 1.8%(+2.17)#74 | 2.1%(+1.92)#3,629 |
| 75. | Oak Ridge | 4.0% | 1.8%(+2.17)#75 | 2.1%(+1.92)#3,630 |
| 76. | Trimble | 4.0% | 1.8%(+2.14)#76 | 2.1%(+1.89)#3,667 |
| 77. | Bellefontaine Neighbors | 4.0% | 1.8%(+2.13)#77 | 2.1%(+1.88)#3,685 |
| 78. | Green Park | 3.9% | 1.8%(+2.08)#78 | 2.1%(+1.83)#3,740 |
| 79. | Bates City | 3.8% | 1.8%(+2.01)#79 | 2.1%(+1.76)#3,834 |
| 80. | Forsyth | 3.8% | 1.8%(+1.99)#80 | 2.1%(+1.74)#3,866 |
| 81. | Raintree Plantation | 3.8% | 1.8%(+1.97)#81 | 2.1%(+1.72)#3,890 |
| 82. | Eldon | 3.8% | 1.8%(+1.96)#82 | 2.1%(+1.71)#3,909 |
| 83. | Amsterdam | 3.8% | 1.8%(+1.94)#83 | 2.1%(+1.69)#3,939 |
| 84. | Lewis And Clark Village | 3.7% | 1.8%(+1.87)#84 | 2.1%(+1.62)#4,066 |
| 85. | Grantwood Village | 3.7% | 1.8%(+1.85)#85 | 2.1%(+1.61)#4,089 |
| 86. | Clever | 3.7% | 1.8%(+1.85)#86 | 2.1%(+1.60)#4,093 |
| 87. | Northwoods | 3.7% | 1.8%(+1.83)#87 | 2.1%(+1.58)#4,128 |
| 88. | Urbana | 3.6% | 1.8%(+1.80)#88 | 2.1%(+1.55)#4,159 |
| 89. | Richmond Heights | 3.6% | 1.8%(+1.75)#89 | 2.1%(+1.50)#4,243 |
| 90. | Wildwood | 3.6% | 1.8%(+1.72)#90 | 2.1%(+1.47)#4,296 |
| 91. | Altenburg | 3.5% | 1.8%(+1.70)#91 | 2.1%(+1.45)#4,327 |
| 92. | Wheeling | 3.5% | 1.8%(+1.67)#92 | 2.1%(+1.43)#4,377 |
| 93. | Canton | 3.5% | 1.8%(+1.62)#93 | 2.1%(+1.37)#4,469 |
| 94. | Westwood | 3.4% | 1.8%(+1.61)#94 | 2.1%(+1.37)#4,493 |
| 95. | Bakersfield | 3.4% | 1.8%(+1.61)#95 | 2.1%(+1.37)#4,495 |
| 96. | Williamsville | 3.4% | 1.8%(+1.58)#96 | 2.1%(+1.33)#4,571 |
| 97. | Oaks | 3.4% | 1.8%(+1.58)#97 | 2.1%(+1.33)#4,575 |
| 98. | Lone Jack | 3.4% | 1.8%(+1.55)#98 | 2.1%(+1.30)#4,619 |
| 99. | University City | 3.4% | 1.8%(+1.55)#99 | 2.1%(+1.30)#4,630 |
| 100. | Everton | 3.4% | 1.8%(+1.54)#100 | 2.1%(+1.29)#4,644 |
Common Questions
What are the Top 10 Cities with the Highest Percentage of Population Employed in Arts, Entertainment & Recreation in Missouri?
Top 10 Cities with the Highest Percentage of Population Employed in Arts, Entertainment & Recreation in Missouri are:
#1
25.2%
#2
25.0%
#3
20.4%
#4
18.3%
#5
16.1%
#6
15.7%
#7
14.5%
#8
14.5%
#9
13.3%
#10
12.5%
What city has the Highest Percentage of Population Employed in Arts, Entertainment & Recreation in Missouri?
Branson West has the Highest Percentage of Population Employed in Arts, Entertainment & Recreation in Missouri with 25.2%.
What is the Percentage of Population Employed in Arts, Entertainment & Recreation in the State of Missouri?
Percentage of Population Employed in Arts, Entertainment & Recreation in Missouri is 1.8%.
What is the Percentage of Population Employed in Arts, Entertainment & Recreation in the United States?
Percentage of Population Employed in Arts, Entertainment & Recreation in the United States is 2.1%.