Cities with the Highest Percentage of Population Employed in Arts, Entertainment & Recreation in Kansas
RELATED REPORTS & OPTIONS
Arts, Entertainment & Recreation
Kansas
Compare Cities
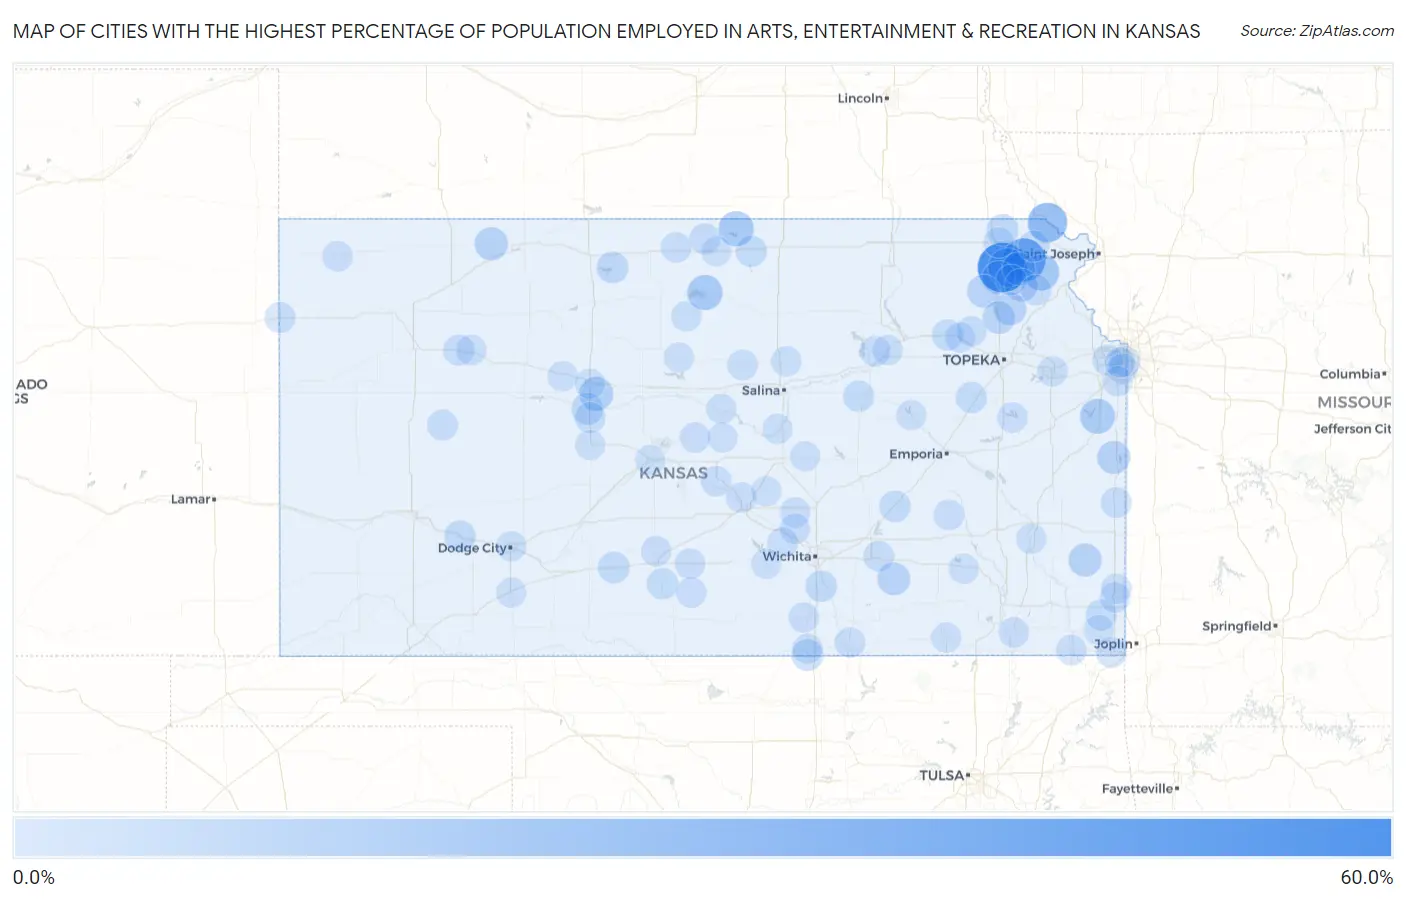
Map of Cities with the Highest Percentage of Population Employed in Arts, Entertainment & Recreation in Kansas
0.0%
60.0%
Cities with the Highest Percentage of Population Employed in Arts, Entertainment & Recreation in Kansas
| City | % Employed | vs State | vs National | |
| 1. | Kickapoo Site 5 | 60.0% | 1.7%(+58.3)#1 | 2.1%(+57.9)#22 |
| 2. | Willis | 41.7% | 1.7%(+39.9)#2 | 2.1%(+39.6)#66 |
| 3. | White Cloud | 28.9% | 1.7%(+27.2)#3 | 2.1%(+26.9)#131 |
| 4. | Kickapoo Tribal Center | 27.1% | 1.7%(+25.3)#4 | 2.1%(+25.0)#161 |
| 5. | Wabaunsee | 19.6% | 1.7%(+17.8)#5 | 2.1%(+17.5)#279 |
| 6. | Huron | 18.8% | 1.7%(+17.0)#6 | 2.1%(+16.7)#298 |
| 7. | Webber | 16.7% | 1.7%(+14.9)#7 | 2.1%(+14.6)#385 |
| 8. | Glen Elder | 16.5% | 1.7%(+14.8)#8 | 2.1%(+14.4)#389 |
| 9. | Hillsdale | 16.1% | 1.7%(+14.3)#9 | 2.1%(+14.0)#407 |
| 10. | Munjor | 13.2% | 1.7%(+11.5)#10 | 2.1%(+11.1)#581 |
| 11. | Tecumseh | 12.7% | 1.7%(+10.9)#11 | 2.1%(+10.6)#616 |
| 12. | Norcatur | 11.1% | 1.7%(+9.36)#12 | 2.1%(+9.03)#757 |
| 13. | Hepler | 10.9% | 1.7%(+9.12)#13 | 2.1%(+8.79)#781 |
| 14. | Linn Valley | 10.8% | 1.7%(+9.06)#14 | 2.1%(+8.72)#788 |
| 15. | Netawaka | 10.8% | 1.7%(+9.01)#15 | 2.1%(+8.67)#797 |
| 16. | Circleville | 10.4% | 1.7%(+8.70)#16 | 2.1%(+8.37)#839 |
| 17. | Horton | 10.0% | 1.7%(+8.27)#17 | 2.1%(+7.93)#902 |
| 18. | Muscotah | 10.0% | 1.7%(+8.25)#18 | 2.1%(+7.92)#908 |
| 19. | Denison | 9.9% | 1.7%(+8.11)#19 | 2.1%(+7.78)#937 |
| 20. | Latham | 9.7% | 1.7%(+7.93)#20 | 2.1%(+7.59)#968 |
| 21. | Mayetta | 9.0% | 1.7%(+7.30)#21 | 2.1%(+6.96)#1,066 |
| 22. | Schoenchen | 7.0% | 1.7%(+5.23)#22 | 2.1%(+4.89)#1,606 |
| 23. | Morrill | 6.8% | 1.7%(+5.01)#23 | 2.1%(+4.67)#1,669 |
| 24. | Kirwin | 6.7% | 1.7%(+4.92)#24 | 2.1%(+4.58)#1,699 |
| 25. | Hunnewell | 6.7% | 1.7%(+4.92)#25 | 2.1%(+4.58)#1,702 |
| 26. | Haviland | 6.5% | 1.7%(+4.75)#26 | 2.1%(+4.41)#1,770 |
| 27. | Mulvane | 6.2% | 1.7%(+4.43)#27 | 2.1%(+4.09)#1,908 |
| 28. | Ingalls | 5.8% | 1.7%(+4.01)#28 | 2.1%(+3.67)#2,120 |
| 29. | Cassoday | 5.6% | 1.7%(+3.81)#29 | 2.1%(+3.47)#2,241 |
| 30. | Sawyer | 5.4% | 1.7%(+3.66)#30 | 2.1%(+3.32)#2,324 |
| 31. | Belvue | 5.4% | 1.7%(+3.63)#31 | 2.1%(+3.29)#2,339 |
| 32. | Courtland | 5.1% | 1.7%(+3.34)#32 | 2.1%(+3.00)#2,538 |
| 33. | Robinson | 5.0% | 1.7%(+3.25)#33 | 2.1%(+2.92)#2,606 |
| 34. | Harveyville | 5.0% | 1.7%(+3.25)#34 | 2.1%(+2.92)#2,608 |
| 35. | Woodbine | 4.9% | 1.7%(+3.17)#35 | 2.1%(+2.84)#2,671 |
| 36. | Scammon | 4.9% | 1.7%(+3.12)#36 | 2.1%(+2.78)#2,711 |
| 37. | Grainfield | 4.7% | 1.7%(+2.98)#37 | 2.1%(+2.64)#2,819 |
| 38. | Burr Oak | 4.5% | 1.7%(+2.80)#38 | 2.1%(+2.46)#2,980 |
| 39. | Westwood | 4.4% | 1.7%(+2.61)#39 | 2.1%(+2.28)#3,191 |
| 40. | Healy | 4.3% | 1.7%(+2.51)#40 | 2.1%(+2.17)#3,325 |
| 41. | Leon | 4.1% | 1.7%(+2.38)#41 | 2.1%(+2.04)#3,488 |
| 42. | Liebenthal | 4.0% | 1.7%(+2.25)#42 | 2.1%(+1.92)#3,636 |
| 43. | Whiting | 4.0% | 1.7%(+2.22)#43 | 2.1%(+1.89)#3,679 |
| 44. | Prescott | 3.9% | 1.7%(+2.15)#44 | 2.1%(+1.81)#3,767 |
| 45. | Effingham | 3.9% | 1.7%(+2.12)#45 | 2.1%(+1.79)#3,798 |
| 46. | Kanorado | 3.8% | 1.7%(+2.10)#46 | 2.1%(+1.76)#3,829 |
| 47. | Baxter Springs | 3.7% | 1.7%(+1.97)#47 | 2.1%(+1.63)#4,031 |
| 48. | Lake Quivira | 3.7% | 1.7%(+1.96)#48 | 2.1%(+1.62)#4,053 |
| 49. | Fort Riley | 3.7% | 1.7%(+1.95)#49 | 2.1%(+1.61)#4,081 |
| 50. | Bird City | 3.7% | 1.7%(+1.93)#50 | 2.1%(+1.59)#4,107 |
| 51. | Sterling | 3.6% | 1.7%(+1.84)#51 | 2.1%(+1.51)#4,228 |
| 52. | Beverly | 3.6% | 1.7%(+1.82)#52 | 2.1%(+1.49)#4,272 |
| 53. | Hamilton | 3.5% | 1.7%(+1.78)#53 | 2.1%(+1.45)#4,339 |
| 54. | Lebanon | 3.5% | 1.7%(+1.78)#54 | 2.1%(+1.45)#4,342 |
| 55. | Andale | 3.5% | 1.7%(+1.72)#55 | 2.1%(+1.38)#4,452 |
| 56. | Nashville | 3.4% | 1.7%(+1.70)#56 | 2.1%(+1.37)#4,501 |
| 57. | Iuka | 3.4% | 1.7%(+1.64)#57 | 2.1%(+1.31)#4,612 |
| 58. | Bushton | 3.3% | 1.7%(+1.55)#58 | 2.1%(+1.21)#4,789 |
| 59. | Cunningham | 3.3% | 1.7%(+1.53)#59 | 2.1%(+1.20)#4,825 |
| 60. | Willowbrook | 3.2% | 1.7%(+1.48)#60 | 2.1%(+1.14)#4,922 |
| 61. | Prairie Village | 3.2% | 1.7%(+1.43)#61 | 2.1%(+1.10)#5,005 |
| 62. | Chetopa | 3.2% | 1.7%(+1.43)#62 | 2.1%(+1.09)#5,009 |
| 63. | Vassar | 3.2% | 1.7%(+1.43)#63 | 2.1%(+1.09)#5,010 |
| 64. | Halstead | 3.2% | 1.7%(+1.42)#64 | 2.1%(+1.09)#5,024 |
| 65. | Fairview | 3.2% | 1.7%(+1.42)#65 | 2.1%(+1.08)#5,027 |
| 66. | Park | 3.1% | 1.7%(+1.33)#66 | 2.1%(+0.994)#5,237 |
| 67. | Wellington | 3.1% | 1.7%(+1.33)#67 | 2.1%(+0.992)#5,240 |
| 68. | Pittsburg | 3.1% | 1.7%(+1.32)#68 | 2.1%(+0.982)#5,263 |
| 69. | Bentley | 3.1% | 1.7%(+1.31)#69 | 2.1%(+0.979)#5,270 |
| 70. | Lawrence | 3.1% | 1.7%(+1.30)#70 | 2.1%(+0.969)#5,294 |
| 71. | Liberty | 3.0% | 1.7%(+1.28)#71 | 2.1%(+0.948)#5,334 |
| 72. | Arkansas City | 3.0% | 1.7%(+1.25)#72 | 2.1%(+0.910)#5,406 |
| 73. | St Marys | 2.9% | 1.7%(+1.20)#73 | 2.1%(+0.863)#5,520 |
| 74. | Dodge City | 2.9% | 1.7%(+1.19)#74 | 2.1%(+0.853)#5,542 |
| 75. | Delia | 2.9% | 1.7%(+1.17)#75 | 2.1%(+0.837)#5,576 |
| 76. | Tipton | 2.9% | 1.7%(+1.15)#76 | 2.1%(+0.816)#5,631 |
| 77. | Frontenac | 2.9% | 1.7%(+1.11)#77 | 2.1%(+0.775)#5,737 |
| 78. | Ogden | 2.9% | 1.7%(+1.11)#78 | 2.1%(+0.770)#5,771 |
| 79. | Bennington | 2.8% | 1.7%(+1.08)#79 | 2.1%(+0.744)#5,831 |
| 80. | South Haven | 2.8% | 1.7%(+1.06)#80 | 2.1%(+0.726)#5,889 |
| 81. | Sedan | 2.8% | 1.7%(+1.04)#81 | 2.1%(+0.702)#5,942 |
| 82. | Fall River | 2.8% | 1.7%(+1.03)#82 | 2.1%(+0.695)#5,977 |
| 83. | Ellis | 2.7% | 1.7%(+0.961)#83 | 2.1%(+0.625)#6,169 |
| 84. | Mankato | 2.7% | 1.7%(+0.941)#84 | 2.1%(+0.606)#6,225 |
| 85. | Minneola | 2.7% | 1.7%(+0.911)#85 | 2.1%(+0.575)#6,316 |
| 86. | Lucas | 2.7% | 1.7%(+0.908)#86 | 2.1%(+0.572)#6,321 |
| 87. | Buhler | 2.7% | 1.7%(+0.907)#87 | 2.1%(+0.571)#6,328 |
| 88. | Overland Park | 2.6% | 1.7%(+0.890)#88 | 2.1%(+0.555)#6,375 |
| 89. | Council Grove | 2.6% | 1.7%(+0.833)#89 | 2.1%(+0.498)#6,546 |
| 90. | Columbus | 2.6% | 1.7%(+0.813)#90 | 2.1%(+0.477)#6,608 |
| 91. | Mission | 2.5% | 1.7%(+0.791)#91 | 2.1%(+0.455)#6,685 |
| 92. | Canton | 2.5% | 1.7%(+0.753)#92 | 2.1%(+0.417)#6,825 |
| 93. | Geneseo | 2.5% | 1.7%(+0.722)#93 | 2.1%(+0.387)#6,914 |
| 94. | Cheney | 2.5% | 1.7%(+0.711)#94 | 2.1%(+0.375)#6,960 |
| 95. | Kanopolis | 2.4% | 1.7%(+0.701)#95 | 2.1%(+0.365)#6,992 |
| 96. | Hays | 2.4% | 1.7%(+0.639)#96 | 2.1%(+0.303)#7,203 |
| 97. | Lindsborg | 2.4% | 1.7%(+0.635)#97 | 2.1%(+0.300)#7,210 |
| 98. | Humboldt | 2.4% | 1.7%(+0.618)#98 | 2.1%(+0.283)#7,272 |
| 99. | Great Bend | 2.3% | 1.7%(+0.590)#99 | 2.1%(+0.254)#7,366 |
| 100. | Rush Center | 2.3% | 1.7%(+0.579)#100 | 2.1%(+0.243)#7,404 |
Common Questions
What are the Top 10 Cities with the Highest Percentage of Population Employed in Arts, Entertainment & Recreation in Kansas?
Top 10 Cities with the Highest Percentage of Population Employed in Arts, Entertainment & Recreation in Kansas are:
#1
60.0%
#2
41.7%
#3
28.9%
#4
27.1%
#5
18.8%
#6
16.7%
#7
16.5%
#8
16.1%
#9
13.2%
#10
11.1%
What city has the Highest Percentage of Population Employed in Arts, Entertainment & Recreation in Kansas?
Kickapoo Site 5 has the Highest Percentage of Population Employed in Arts, Entertainment & Recreation in Kansas with 60.0%.
What is the Percentage of Population Employed in Arts, Entertainment & Recreation in the State of Kansas?
Percentage of Population Employed in Arts, Entertainment & Recreation in Kansas is 1.7%.
What is the Percentage of Population Employed in Arts, Entertainment & Recreation in the United States?
Percentage of Population Employed in Arts, Entertainment & Recreation in the United States is 2.1%.