Zip Codes with the Highest Percentage of Population Employed in Arts, Entertainment & Recreation in Kent, WA
RELATED REPORTS & OPTIONS
Arts, Entertainment & Recreation
Kent
Compare Zip Codes
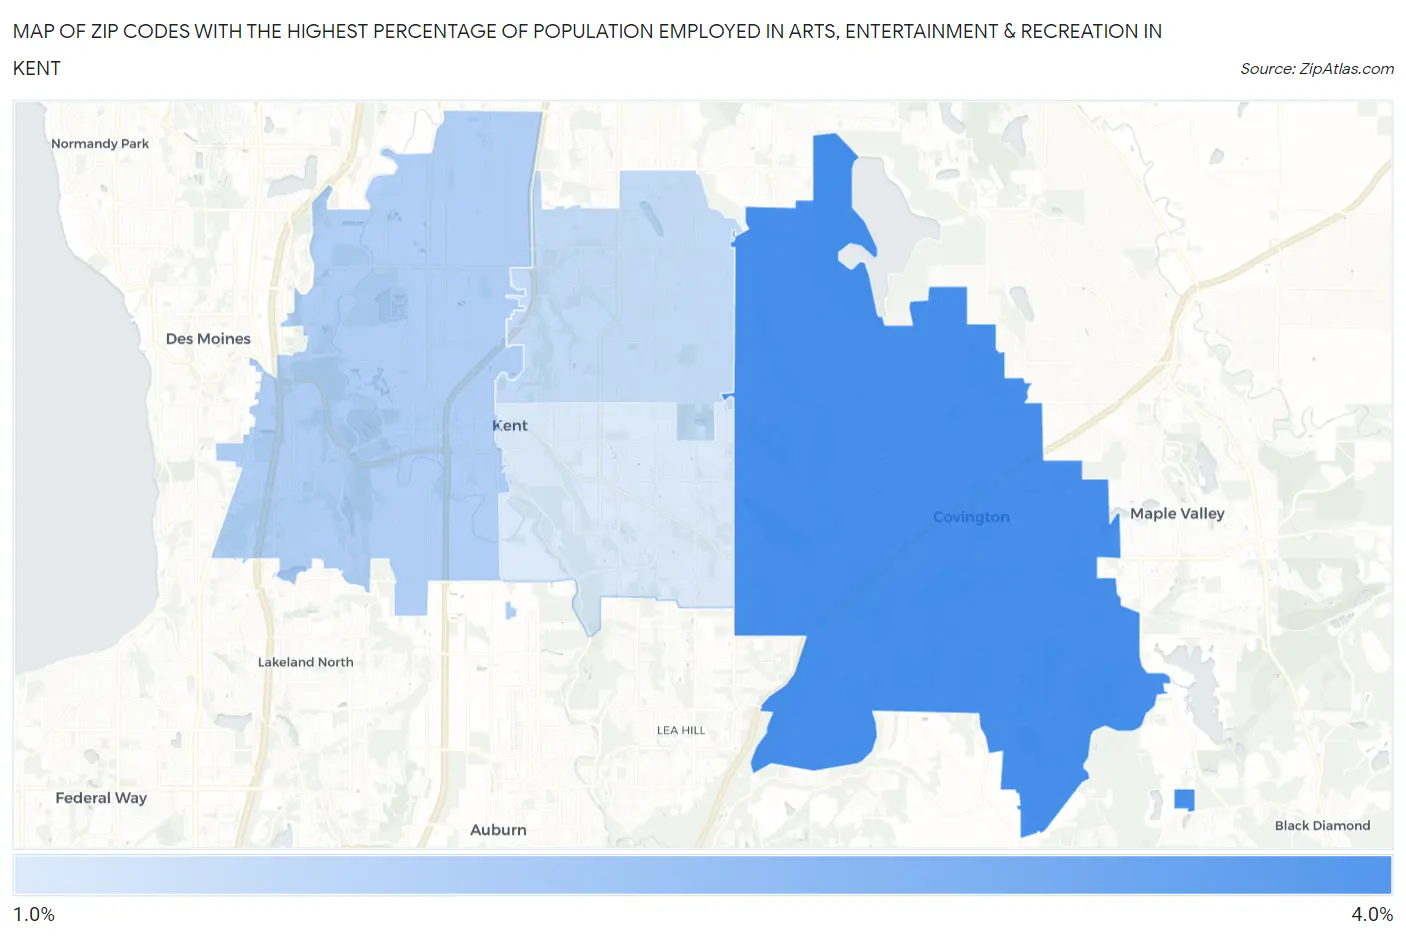
Map of Zip Codes with the Highest Percentage of Population Employed in Arts, Entertainment & Recreation in Kent
1.3%
3.4%
Zip Codes with the Highest Percentage of Population Employed in Arts, Entertainment & Recreation in Kent, WA
| Zip Code | % Employed | vs State | vs National | |
| 1. | 98042 | 3.4% | 2.1%(+1.30)#109 | 2.1%(+1.37)#4,247 |
| 2. | 98032 | 1.9% | 2.1%(-0.256)#261 | 2.1%(-0.193)#10,427 |
| 3. | 98031 | 1.6% | 2.1%(-0.503)#297 | 2.1%(-0.439)#12,139 |
| 4. | 98030 | 1.3% | 2.1%(-0.875)#343 | 2.1%(-0.811)#14,925 |
1
Common Questions
What are the Top 3 Zip Codes with the Highest Percentage of Population Employed in Arts, Entertainment & Recreation in Kent, WA?
Top 3 Zip Codes with the Highest Percentage of Population Employed in Arts, Entertainment & Recreation in Kent, WA are:
What zip code has the Highest Percentage of Population Employed in Arts, Entertainment & Recreation in Kent, WA?
98042 has the Highest Percentage of Population Employed in Arts, Entertainment & Recreation in Kent, WA with 3.4%.
What is the Percentage of Population Employed in Arts, Entertainment & Recreation in Kent, WA?
Percentage of Population Employed in Arts, Entertainment & Recreation in Kent is 1.6%.
What is the Percentage of Population Employed in Arts, Entertainment & Recreation in Washington?
Percentage of Population Employed in Arts, Entertainment & Recreation in Washington is 2.1%.
What is the Percentage of Population Employed in Arts, Entertainment & Recreation in the United States?
Percentage of Population Employed in Arts, Entertainment & Recreation in the United States is 2.1%.