Cities with the Highest Percentage of Population Employed in Arts, Entertainment & Recreation in Pennsylvania
RELATED REPORTS & OPTIONS
Arts, Entertainment & Recreation
Pennsylvania
Compare Cities
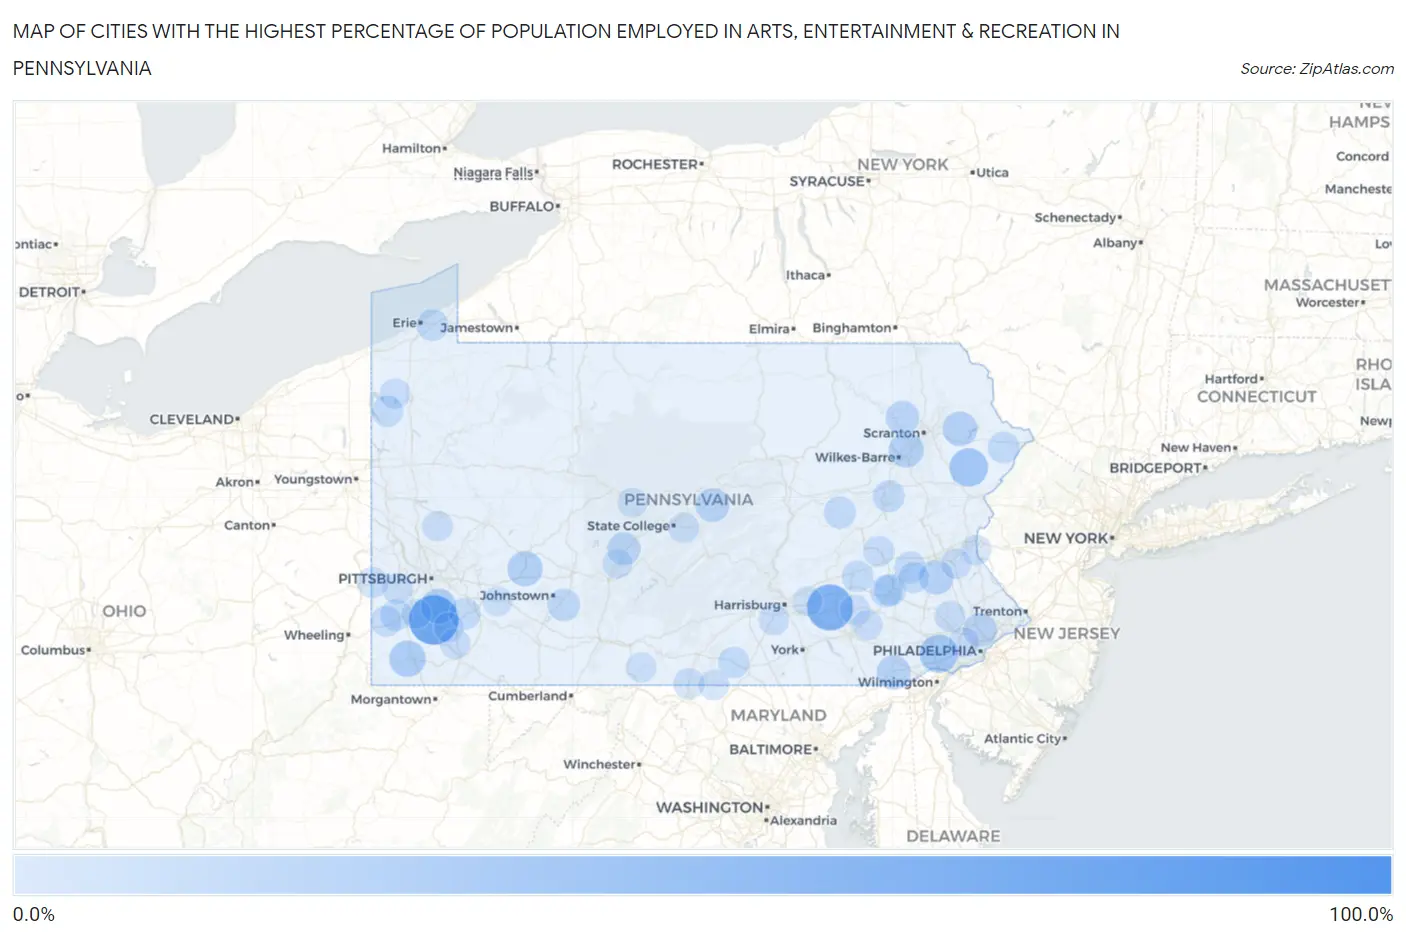
Map of Cities with the Highest Percentage of Population Employed in Arts, Entertainment & Recreation in Pennsylvania
0.0%
100.0%
Cities with the Highest Percentage of Population Employed in Arts, Entertainment & Recreation in Pennsylvania
| City | % Employed | vs State | vs National | |
| 1. | Driftwood Borough | 83.3% | 1.8%(+81.5)#1 | 2.1%(+81.3)#14 |
| 2. | Van Voorhis | 59.6% | 1.8%(+57.8)#2 | 2.1%(+57.5)#23 |
| 3. | Timber Hills | 49.5% | 1.8%(+47.7)#3 | 2.1%(+47.4)#44 |
| 4. | Olivia | 39.5% | 1.8%(+37.7)#4 | 2.1%(+37.5)#73 |
| 5. | University Of Pittsburgh Bradford | 32.4% | 1.8%(+30.6)#5 | 2.1%(+30.3)#110 |
| 6. | Mountainhome | 28.3% | 1.8%(+26.5)#6 | 2.1%(+26.3)#138 |
| 7. | Cheyney University | 27.9% | 1.8%(+26.1)#7 | 2.1%(+25.8)#144 |
| 8. | S N P J Borough | 25.0% | 1.8%(+23.2)#8 | 2.1%(+22.9)#182 |
| 9. | West Waynesburg | 22.5% | 1.8%(+20.7)#9 | 2.1%(+20.4)#221 |
| 10. | Elrama | 20.0% | 1.8%(+18.2)#10 | 2.1%(+17.9)#269 |
| 11. | Graceton | 19.2% | 1.8%(+17.4)#11 | 2.1%(+17.1)#286 |
| 12. | Inkerman | 18.8% | 1.8%(+17.0)#12 | 2.1%(+16.8)#291 |
| 13. | Alba Borough | 18.4% | 1.8%(+16.6)#13 | 2.1%(+16.3)#309 |
| 14. | The Hideout | 17.9% | 1.8%(+16.1)#14 | 2.1%(+15.9)#328 |
| 15. | Hamorton | 17.2% | 1.8%(+15.4)#15 | 2.1%(+15.2)#353 |
| 16. | Hereford | 17.0% | 1.8%(+15.2)#16 | 2.1%(+14.9)#371 |
| 17. | Lincoln University | 16.7% | 1.8%(+14.9)#17 | 2.1%(+14.6)#377 |
| 18. | Madisonburg | 15.7% | 1.8%(+13.9)#18 | 2.1%(+13.6)#427 |
| 19. | Arcadia University | 15.5% | 1.8%(+13.7)#19 | 2.1%(+13.4)#439 |
| 20. | East Altoona | 15.4% | 1.8%(+13.6)#20 | 2.1%(+13.3)#440 |
| 21. | Lake Winola | 14.4% | 1.8%(+12.6)#21 | 2.1%(+12.3)#501 |
| 22. | Ohiopyle Borough | 13.6% | 1.8%(+11.8)#22 | 2.1%(+11.6)#553 |
| 23. | Tipton | 13.2% | 1.8%(+11.4)#23 | 2.1%(+11.1)#579 |
| 24. | Ore Hill | 13.1% | 1.8%(+11.3)#24 | 2.1%(+11.0)#591 |
| 25. | University Of Pittsburgh Johnstown | 12.3% | 1.8%(+10.5)#25 | 2.1%(+10.2)#644 |
| 26. | Ursina Borough | 12.1% | 1.8%(+10.3)#26 | 2.1%(+10.0)#658 |
| 27. | Markleysburg Borough | 11.1% | 1.8%(+9.31)#27 | 2.1%(+9.03)#755 |
| 28. | Jackson Center Borough | 10.9% | 1.8%(+9.14)#28 | 2.1%(+8.85)#775 |
| 29. | Kutztown University | 10.9% | 1.8%(+9.09)#29 | 2.1%(+8.80)#780 |
| 30. | Harleigh | 10.8% | 1.8%(+8.99)#30 | 2.1%(+8.71)#791 |
| 31. | Spring Ridge | 10.7% | 1.8%(+8.93)#31 | 2.1%(+8.64)#801 |
| 32. | Penn State Erie Behrend | 10.5% | 1.8%(+8.71)#32 | 2.1%(+8.42)#831 |
| 33. | Numidia | 10.4% | 1.8%(+8.62)#33 | 2.1%(+8.33)#842 |
| 34. | Sunrise Lake | 10.4% | 1.8%(+8.56)#34 | 2.1%(+8.28)#852 |
| 35. | Greenfields | 10.1% | 1.8%(+8.33)#35 | 2.1%(+8.05)#889 |
| 36. | Wolfdale | 9.8% | 1.8%(+8.05)#36 | 2.1%(+7.77)#940 |
| 37. | Georgetown Borough | 9.6% | 1.8%(+7.77)#37 | 2.1%(+7.48)#988 |
| 38. | North Wales Borough | 9.6% | 1.8%(+7.76)#38 | 2.1%(+7.47)#991 |
| 39. | Rehrersburg | 9.4% | 1.8%(+7.65)#39 | 2.1%(+7.37)#1,006 |
| 40. | Wyano | 9.4% | 1.8%(+7.63)#40 | 2.1%(+7.34)#1,012 |
| 41. | Snydertown Borough | 9.4% | 1.8%(+7.61)#41 | 2.1%(+7.33)#1,016 |
| 42. | Port Vue Borough | 9.4% | 1.8%(+7.60)#42 | 2.1%(+7.31)#1,019 |
| 43. | Stockdale Borough | 9.4% | 1.8%(+7.55)#43 | 2.1%(+7.27)#1,023 |
| 44. | Hartstown | 8.8% | 1.8%(+7.02)#44 | 2.1%(+6.74)#1,096 |
| 45. | Mcknightstown | 8.8% | 1.8%(+6.99)#45 | 2.1%(+6.71)#1,109 |
| 46. | Kutztown Borough | 8.7% | 1.8%(+6.86)#46 | 2.1%(+6.57)#1,146 |
| 47. | State Line | 8.6% | 1.8%(+6.81)#47 | 2.1%(+6.52)#1,155 |
| 48. | Delaware Water Gap Borough | 8.6% | 1.8%(+6.77)#48 | 2.1%(+6.49)#1,163 |
| 49. | Loretto Borough | 8.5% | 1.8%(+6.74)#49 | 2.1%(+6.46)#1,174 |
| 50. | Lenhartsville Borough | 8.5% | 1.8%(+6.74)#50 | 2.1%(+6.45)#1,178 |
| 51. | Misericordia University | 8.5% | 1.8%(+6.68)#51 | 2.1%(+6.39)#1,190 |
| 52. | Villanova | 8.5% | 1.8%(+6.67)#52 | 2.1%(+6.39)#1,192 |
| 53. | Paris | 8.4% | 1.8%(+6.59)#53 | 2.1%(+6.31)#1,202 |
| 54. | Glenfield Borough | 8.3% | 1.8%(+6.47)#54 | 2.1%(+6.19)#1,233 |
| 55. | Moose Run | 8.3% | 1.8%(+6.47)#55 | 2.1%(+6.18)#1,235 |
| 56. | Burnside Borough | 7.8% | 1.8%(+6.01)#56 | 2.1%(+5.73)#1,348 |
| 57. | New Jerusalem | 7.8% | 1.8%(+5.98)#57 | 2.1%(+5.69)#1,357 |
| 58. | Evansburg | 7.7% | 1.8%(+5.86)#58 | 2.1%(+5.57)#1,407 |
| 59. | Rosslyn Farms Borough | 7.7% | 1.8%(+5.86)#59 | 2.1%(+5.57)#1,408 |
| 60. | Greensboro Borough | 7.6% | 1.8%(+5.76)#60 | 2.1%(+5.48)#1,437 |
| 61. | Collegeville Borough | 7.5% | 1.8%(+5.75)#61 | 2.1%(+5.47)#1,439 |
| 62. | Deer Lake | 7.5% | 1.8%(+5.66)#62 | 2.1%(+5.38)#1,468 |
| 63. | Taylorstown | 7.4% | 1.8%(+5.64)#63 | 2.1%(+5.36)#1,474 |
| 64. | Midway | 7.2% | 1.8%(+5.42)#64 | 2.1%(+5.14)#1,530 |
| 65. | Harmonsburg | 7.0% | 1.8%(+5.24)#65 | 2.1%(+4.96)#1,581 |
| 66. | Ligonier Borough | 6.8% | 1.8%(+4.96)#66 | 2.1%(+4.67)#1,670 |
| 67. | Nixon | 6.8% | 1.8%(+4.95)#67 | 2.1%(+4.67)#1,671 |
| 68. | Donegal Borough | 6.7% | 1.8%(+4.87)#68 | 2.1%(+4.58)#1,697 |
| 69. | Laurel Mountain Borough | 6.7% | 1.8%(+4.87)#69 | 2.1%(+4.58)#1,698 |
| 70. | Boalsburg | 6.6% | 1.8%(+4.80)#70 | 2.1%(+4.51)#1,726 |
| 71. | Messiah College | 6.6% | 1.8%(+4.76)#71 | 2.1%(+4.47)#1,741 |
| 72. | New Centerville Borough | 6.6% | 1.8%(+4.76)#72 | 2.1%(+4.47)#1,745 |
| 73. | Nuangola Borough | 6.5% | 1.8%(+4.73)#73 | 2.1%(+4.44)#1,753 |
| 74. | Pen Mar | 6.5% | 1.8%(+4.72)#74 | 2.1%(+4.44)#1,761 |
| 75. | Arendtsville Borough | 6.5% | 1.8%(+4.71)#75 | 2.1%(+4.42)#1,765 |
| 76. | Hopeland | 6.5% | 1.8%(+4.70)#76 | 2.1%(+4.41)#1,771 |
| 77. | Narberth Borough | 6.3% | 1.8%(+4.52)#77 | 2.1%(+4.24)#1,853 |
| 78. | Smock | 6.3% | 1.8%(+4.48)#78 | 2.1%(+4.20)#1,863 |
| 79. | Raubsville | 6.3% | 1.8%(+4.46)#79 | 2.1%(+4.18)#1,874 |
| 80. | Desales University | 6.2% | 1.8%(+4.45)#80 | 2.1%(+4.17)#1,875 |
| 81. | Woodcock Borough | 6.2% | 1.8%(+4.45)#81 | 2.1%(+4.17)#1,881 |
| 82. | Haverford College | 6.2% | 1.8%(+4.38)#82 | 2.1%(+4.09)#1,906 |
| 83. | Eagle Creek | 6.1% | 1.8%(+4.32)#83 | 2.1%(+4.04)#1,930 |
| 84. | Farmersville | 6.0% | 1.8%(+4.25)#84 | 2.1%(+3.96)#1,952 |
| 85. | Fairhope | 6.0% | 1.8%(+4.21)#85 | 2.1%(+3.93)#1,978 |
| 86. | Strasburg Borough | 5.9% | 1.8%(+4.08)#86 | 2.1%(+3.80)#2,037 |
| 87. | Carmichaels Borough | 5.9% | 1.8%(+4.08)#87 | 2.1%(+3.80)#2,041 |
| 88. | Coal Center Borough | 5.9% | 1.8%(+4.08)#88 | 2.1%(+3.80)#2,046 |
| 89. | Needmore | 5.9% | 1.8%(+4.08)#89 | 2.1%(+3.80)#2,048 |
| 90. | Paxtang Borough | 5.8% | 1.8%(+3.98)#90 | 2.1%(+3.70)#2,109 |
| 91. | Elkins Park | 5.7% | 1.8%(+3.87)#91 | 2.1%(+3.58)#2,163 |
| 92. | Barkeyville Borough | 5.6% | 1.8%(+3.85)#92 | 2.1%(+3.56)#2,177 |
| 93. | Houston Borough | 5.6% | 1.8%(+3.83)#93 | 2.1%(+3.55)#2,185 |
| 94. | St Vincent College | 5.6% | 1.8%(+3.83)#94 | 2.1%(+3.55)#2,190 |
| 95. | Greenwood | 5.6% | 1.8%(+3.80)#95 | 2.1%(+3.51)#2,210 |
| 96. | Wylandville | 5.5% | 1.8%(+3.70)#96 | 2.1%(+3.42)#2,265 |
| 97. | Union Deposit | 5.5% | 1.8%(+3.69)#97 | 2.1%(+3.41)#2,270 |
| 98. | Fairchance Borough | 5.5% | 1.8%(+3.69)#98 | 2.1%(+3.40)#2,273 |
| 99. | Morrisdale | 5.4% | 1.8%(+3.61)#99 | 2.1%(+3.33)#2,317 |
| 100. | White Oak Borough | 5.4% | 1.8%(+3.59)#100 | 2.1%(+3.31)#2,335 |
Common Questions
What are the Top 10 Cities with the Highest Percentage of Population Employed in Arts, Entertainment & Recreation in Pennsylvania?
Top 10 Cities with the Highest Percentage of Population Employed in Arts, Entertainment & Recreation in Pennsylvania are:
#1
59.6%
#2
49.5%
#3
28.3%
#4
27.9%
#5
22.5%
#6
20.0%
#7
19.2%
#8
18.8%
#9
17.9%
#10
17.0%
What city has the Highest Percentage of Population Employed in Arts, Entertainment & Recreation in Pennsylvania?
Van Voorhis has the Highest Percentage of Population Employed in Arts, Entertainment & Recreation in Pennsylvania with 59.6%.
What is the Percentage of Population Employed in Arts, Entertainment & Recreation in the State of Pennsylvania?
Percentage of Population Employed in Arts, Entertainment & Recreation in Pennsylvania is 1.8%.
What is the Percentage of Population Employed in Arts, Entertainment & Recreation in the United States?
Percentage of Population Employed in Arts, Entertainment & Recreation in the United States is 2.1%.