Zip Codes with the Highest Percentage of Population Employed in Arts, Entertainment & Recreation in Washington
RELATED REPORTS & OPTIONS
Arts, Entertainment & Recreation
Washington
Compare Zip Codes
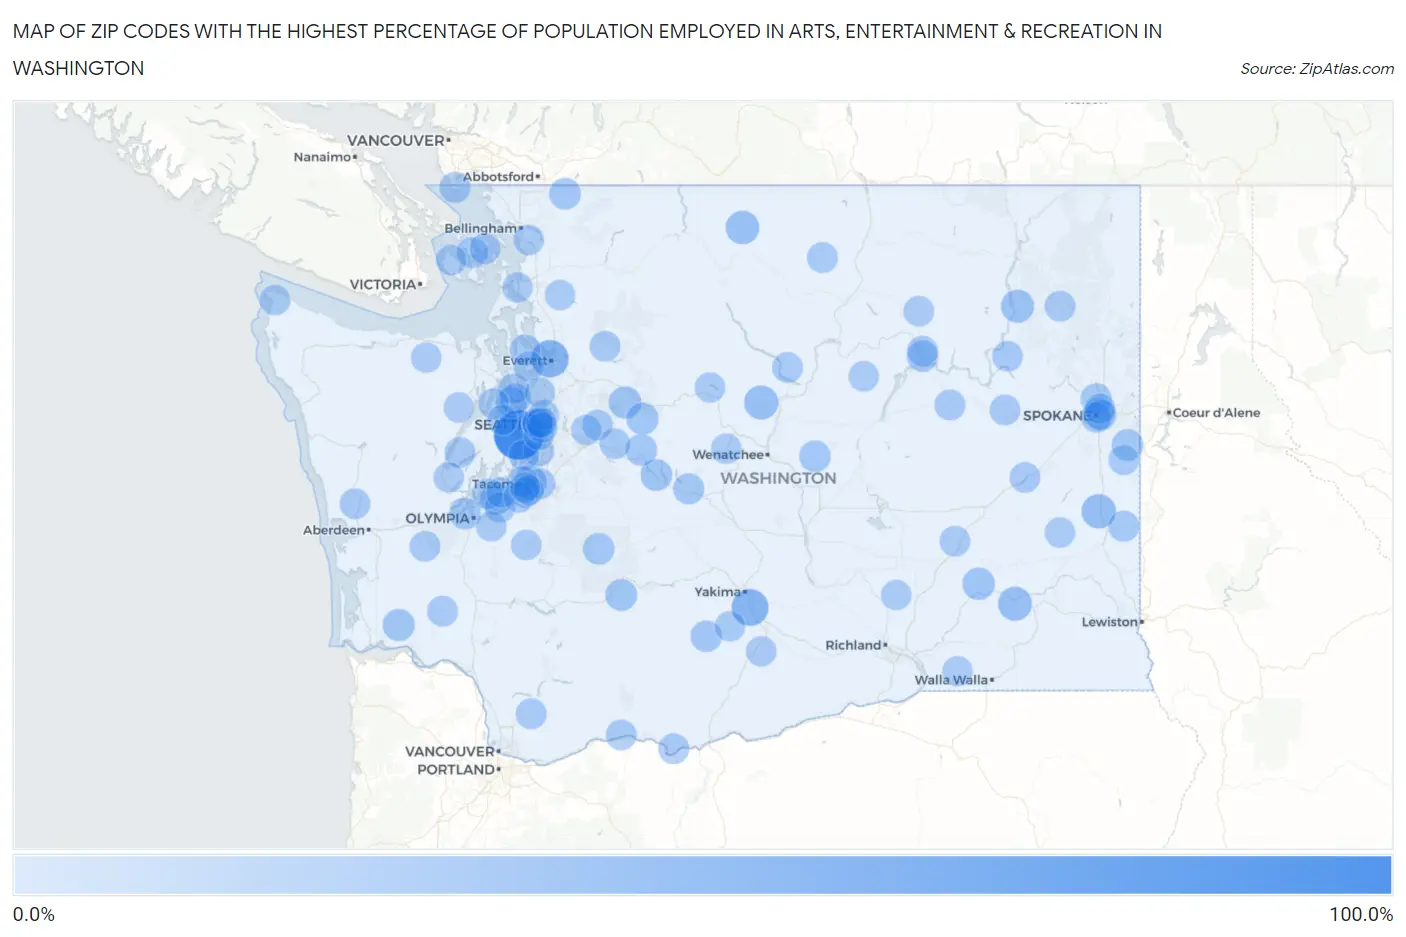
Map of Zip Codes with the Highest Percentage of Population Employed in Arts, Entertainment & Recreation in Washington
0.0%
100.0%
Zip Codes with the Highest Percentage of Population Employed in Arts, Entertainment & Recreation in Washington
| Zip Code | % Employed | vs State | vs National | |
| 1. | 98353 | 100.0% | 2.1%(+97.9)#1 | 2.1%(+97.9)#11 |
| 2. | 98207 | 38.6% | 2.1%(+36.5)#2 | 2.1%(+36.6)#55 |
| 3. | 98939 | 35.5% | 2.1%(+33.3)#3 | 2.1%(+33.4)#63 |
| 4. | 99176 | 23.2% | 2.1%(+21.0)#4 | 2.1%(+21.1)#131 |
| 5. | 98811 | 21.8% | 2.1%(+19.6)#5 | 2.1%(+19.7)#151 |
| 6. | 99359 | 21.1% | 2.1%(+18.9)#6 | 2.1%(+19.0)#166 |
| 7. | 98833 | 19.0% | 2.1%(+16.8)#7 | 2.1%(+16.9)#210 |
| 8. | 99131 | 16.7% | 2.1%(+14.5)#8 | 2.1%(+14.6)#265 |
| 9. | 98421 | 16.4% | 2.1%(+14.2)#9 | 2.1%(+14.3)#274 |
| 10. | 99335 | 14.1% | 2.1%(+12.0)#10 | 2.1%(+12.0)#382 |
| 11. | 98224 | 13.4% | 2.1%(+11.2)#11 | 2.1%(+11.3)#423 |
| 12. | 98621 | 12.0% | 2.1%(+9.85)#12 | 2.1%(+9.92)#508 |
| 13. | 98288 | 11.4% | 2.1%(+9.25)#13 | 2.1%(+9.31)#559 |
| 14. | 98303 | 11.1% | 2.1%(+8.98)#14 | 2.1%(+9.05)#588 |
| 15. | 98925 | 11.0% | 2.1%(+8.81)#15 | 2.1%(+8.87)#606 |
| 16. | 98361 | 10.6% | 2.1%(+8.43)#16 | 2.1%(+8.49)#641 |
| 17. | 98304 | 10.2% | 2.1%(+8.09)#17 | 2.1%(+8.16)#672 |
| 18. | 99030 | 10.2% | 2.1%(+8.06)#18 | 2.1%(+8.13)#676 |
| 19. | 98068 | 10.0% | 2.1%(+7.82)#19 | 2.1%(+7.88)#706 |
| 20. | 98266 | 9.9% | 2.1%(+7.73)#20 | 2.1%(+7.79)#723 |
| 21. | 98505 | 9.8% | 2.1%(+7.68)#21 | 2.1%(+7.74)#727 |
| 22. | 98952 | 9.0% | 2.1%(+6.88)#22 | 2.1%(+6.94)#853 |
| 23. | 98845 | 9.0% | 2.1%(+6.84)#23 | 2.1%(+6.91)#858 |
| 24. | 99258 | 8.3% | 2.1%(+6.19)#24 | 2.1%(+6.25)#977 |
| 25. | 99124 | 7.6% | 2.1%(+5.46)#25 | 2.1%(+5.53)#1,150 |
| 26. | 98392 | 7.6% | 2.1%(+5.44)#26 | 2.1%(+5.51)#1,158 |
| 27. | 98281 | 7.6% | 2.1%(+5.44)#27 | 2.1%(+5.50)#1,160 |
| 28. | 99251 | 7.4% | 2.1%(+5.28)#28 | 2.1%(+5.35)#1,193 |
| 29. | 98941 | 7.2% | 2.1%(+5.05)#29 | 2.1%(+5.11)#1,266 |
| 30. | 99130 | 7.0% | 2.1%(+4.86)#30 | 2.1%(+4.93)#1,327 |
| 31. | 98280 | 6.8% | 2.1%(+4.62)#31 | 2.1%(+4.68)#1,402 |
| 32. | 98342 | 6.3% | 2.1%(+4.12)#32 | 2.1%(+4.19)#1,598 |
| 33. | 99109 | 6.0% | 2.1%(+3.89)#33 | 2.1%(+3.95)#1,679 |
| 34. | 99185 | 6.0% | 2.1%(+3.89)#34 | 2.1%(+3.95)#1,680 |
| 35. | 98346 | 6.0% | 2.1%(+3.88)#35 | 2.1%(+3.94)#1,689 |
| 36. | 98831 | 6.0% | 2.1%(+3.88)#36 | 2.1%(+3.94)#1,694 |
| 37. | 98819 | 6.0% | 2.1%(+3.82)#37 | 2.1%(+3.89)#1,718 |
| 38. | 98279 | 5.9% | 2.1%(+3.80)#38 | 2.1%(+3.87)#1,727 |
| 39. | 98550 | 5.8% | 2.1%(+3.64)#39 | 2.1%(+3.71)#1,812 |
| 40. | 99116 | 5.8% | 2.1%(+3.64)#40 | 2.1%(+3.70)#1,817 |
| 41. | 98260 | 5.7% | 2.1%(+3.52)#41 | 2.1%(+3.59)#1,874 |
| 42. | 98538 | 5.6% | 2.1%(+3.45)#42 | 2.1%(+3.52)#1,909 |
| 43. | 98651 | 5.6% | 2.1%(+3.42)#43 | 2.1%(+3.49)#1,927 |
| 44. | 98588 | 5.6% | 2.1%(+3.41)#44 | 2.1%(+3.47)#1,931 |
| 45. | 98617 | 5.5% | 2.1%(+3.34)#45 | 2.1%(+3.41)#1,969 |
| 46. | 98675 | 5.4% | 2.1%(+3.21)#46 | 2.1%(+3.28)#2,051 |
| 47. | 99341 | 5.3% | 2.1%(+3.14)#47 | 2.1%(+3.21)#2,084 |
| 48. | 99129 | 5.1% | 2.1%(+2.94)#48 | 2.1%(+3.00)#2,223 |
| 49. | 98148 | 5.1% | 2.1%(+2.94)#49 | 2.1%(+3.00)#2,230 |
| 50. | 98164 | 5.1% | 2.1%(+2.93)#50 | 2.1%(+2.99)#2,236 |
| 51. | 98568 | 5.0% | 2.1%(+2.87)#51 | 2.1%(+2.93)#2,278 |
| 52. | 98354 | 5.0% | 2.1%(+2.85)#52 | 2.1%(+2.91)#2,292 |
| 53. | 99202 | 4.9% | 2.1%(+2.78)#53 | 2.1%(+2.84)#2,342 |
| 54. | 99122 | 4.9% | 2.1%(+2.74)#54 | 2.1%(+2.81)#2,369 |
| 55. | 98252 | 4.9% | 2.1%(+2.72)#55 | 2.1%(+2.79)#2,385 |
| 56. | 98104 | 4.7% | 2.1%(+2.57)#56 | 2.1%(+2.64)#2,511 |
| 57. | 98315 | 4.6% | 2.1%(+2.50)#57 | 2.1%(+2.56)#2,587 |
| 58. | 99032 | 4.6% | 2.1%(+2.49)#58 | 2.1%(+2.55)#2,597 |
| 59. | 98045 | 4.6% | 2.1%(+2.47)#59 | 2.1%(+2.53)#2,615 |
| 60. | 98351 | 4.6% | 2.1%(+2.42)#60 | 2.1%(+2.49)#2,663 |
| 61. | 98065 | 4.6% | 2.1%(+2.42)#61 | 2.1%(+2.49)#2,665 |
| 62. | 98070 | 4.5% | 2.1%(+2.38)#62 | 2.1%(+2.45)#2,706 |
| 63. | 98597 | 4.5% | 2.1%(+2.35)#63 | 2.1%(+2.41)#2,753 |
| 64. | 98327 | 4.4% | 2.1%(+2.23)#64 | 2.1%(+2.29)#2,875 |
| 65. | 98250 | 4.4% | 2.1%(+2.22)#65 | 2.1%(+2.29)#2,878 |
| 66. | 98257 | 4.4% | 2.1%(+2.21)#66 | 2.1%(+2.27)#2,897 |
| 67. | 98847 | 4.3% | 2.1%(+2.19)#67 | 2.1%(+2.25)#2,922 |
| 68. | 98402 | 4.3% | 2.1%(+2.17)#68 | 2.1%(+2.24)#2,935 |
| 69. | 99155 | 4.3% | 2.1%(+2.14)#69 | 2.1%(+2.21)#2,979 |
| 70. | 98388 | 4.2% | 2.1%(+2.04)#70 | 2.1%(+2.11)#3,094 |
| 71. | 98108 | 4.2% | 2.1%(+2.03)#71 | 2.1%(+2.09)#3,113 |
| 72. | 99204 | 4.2% | 2.1%(+2.00)#72 | 2.1%(+2.07)#3,144 |
| 73. | 98830 | 4.1% | 2.1%(+1.93)#73 | 2.1%(+1.99)#3,235 |
| 74. | 99207 | 4.0% | 2.1%(+1.89)#74 | 2.1%(+1.95)#3,287 |
| 75. | 98948 | 4.0% | 2.1%(+1.84)#75 | 2.1%(+1.90)#3,363 |
| 76. | 98826 | 4.0% | 2.1%(+1.82)#76 | 2.1%(+1.89)#3,377 |
| 77. | 99125 | 4.0% | 2.1%(+1.82)#77 | 2.1%(+1.88)#3,385 |
| 78. | 98024 | 3.9% | 2.1%(+1.80)#78 | 2.1%(+1.86)#3,410 |
| 79. | 98362 | 3.9% | 2.1%(+1.75)#79 | 2.1%(+1.82)#3,485 |
| 80. | 98408 | 3.9% | 2.1%(+1.74)#80 | 2.1%(+1.80)#3,506 |
| 81. | 98357 | 3.9% | 2.1%(+1.73)#81 | 2.1%(+1.80)#3,510 |
| 82. | 98320 | 3.9% | 2.1%(+1.72)#82 | 2.1%(+1.78)#3,532 |
| 83. | 98499 | 3.8% | 2.1%(+1.67)#83 | 2.1%(+1.74)#3,602 |
| 84. | 98101 | 3.8% | 2.1%(+1.67)#84 | 2.1%(+1.73)#3,617 |
| 85. | 98584 | 3.8% | 2.1%(+1.66)#85 | 2.1%(+1.72)#3,620 |
| 86. | 99360 | 3.8% | 2.1%(+1.64)#86 | 2.1%(+1.70)#3,654 |
| 87. | 98933 | 3.8% | 2.1%(+1.63)#87 | 2.1%(+1.70)#3,659 |
| 88. | 98236 | 3.8% | 2.1%(+1.63)#88 | 2.1%(+1.70)#3,664 |
| 89. | 98513 | 3.8% | 2.1%(+1.63)#89 | 2.1%(+1.69)#3,667 |
| 90. | 98404 | 3.8% | 2.1%(+1.61)#90 | 2.1%(+1.67)#3,694 |
| 91. | 98229 | 3.7% | 2.1%(+1.54)#91 | 2.1%(+1.60)#3,802 |
| 92. | 99343 | 3.7% | 2.1%(+1.52)#92 | 2.1%(+1.59)#3,823 |
| 93. | 98311 | 3.7% | 2.1%(+1.52)#93 | 2.1%(+1.58)#3,833 |
| 94. | 99012 | 3.6% | 2.1%(+1.50)#94 | 2.1%(+1.57)#3,850 |
| 95. | 98105 | 3.6% | 2.1%(+1.50)#95 | 2.1%(+1.56)#3,859 |
| 96. | 98144 | 3.6% | 2.1%(+1.50)#96 | 2.1%(+1.56)#3,862 |
| 97. | 98122 | 3.6% | 2.1%(+1.42)#97 | 2.1%(+1.48)#4,009 |
| 98. | 98043 | 3.6% | 2.1%(+1.40)#98 | 2.1%(+1.47)#4,029 |
| 99. | 98274 | 3.5% | 2.1%(+1.40)#99 | 2.1%(+1.46)#4,040 |
| 100. | 98418 | 3.5% | 2.1%(+1.39)#100 | 2.1%(+1.46)#4,046 |
Common Questions
What are the Top 10 Zip Codes with the Highest Percentage of Population Employed in Arts, Entertainment & Recreation in Washington?
Top 10 Zip Codes with the Highest Percentage of Population Employed in Arts, Entertainment & Recreation in Washington are:
What zip code has the Highest Percentage of Population Employed in Arts, Entertainment & Recreation in Washington?
98353 has the Highest Percentage of Population Employed in Arts, Entertainment & Recreation in Washington with 100.0%.
What is the Percentage of Population Employed in Arts, Entertainment & Recreation in the State of Washington?
Percentage of Population Employed in Arts, Entertainment & Recreation in Washington is 2.1%.
What is the Percentage of Population Employed in Arts, Entertainment & Recreation in the United States?
Percentage of Population Employed in Arts, Entertainment & Recreation in the United States is 2.1%.