Zip Codes with the Highest Percentage of Population Employed in Arts, Entertainment & Recreation in Renton, WA
RELATED REPORTS & OPTIONS
Arts, Entertainment & Recreation
Renton
Compare Zip Codes
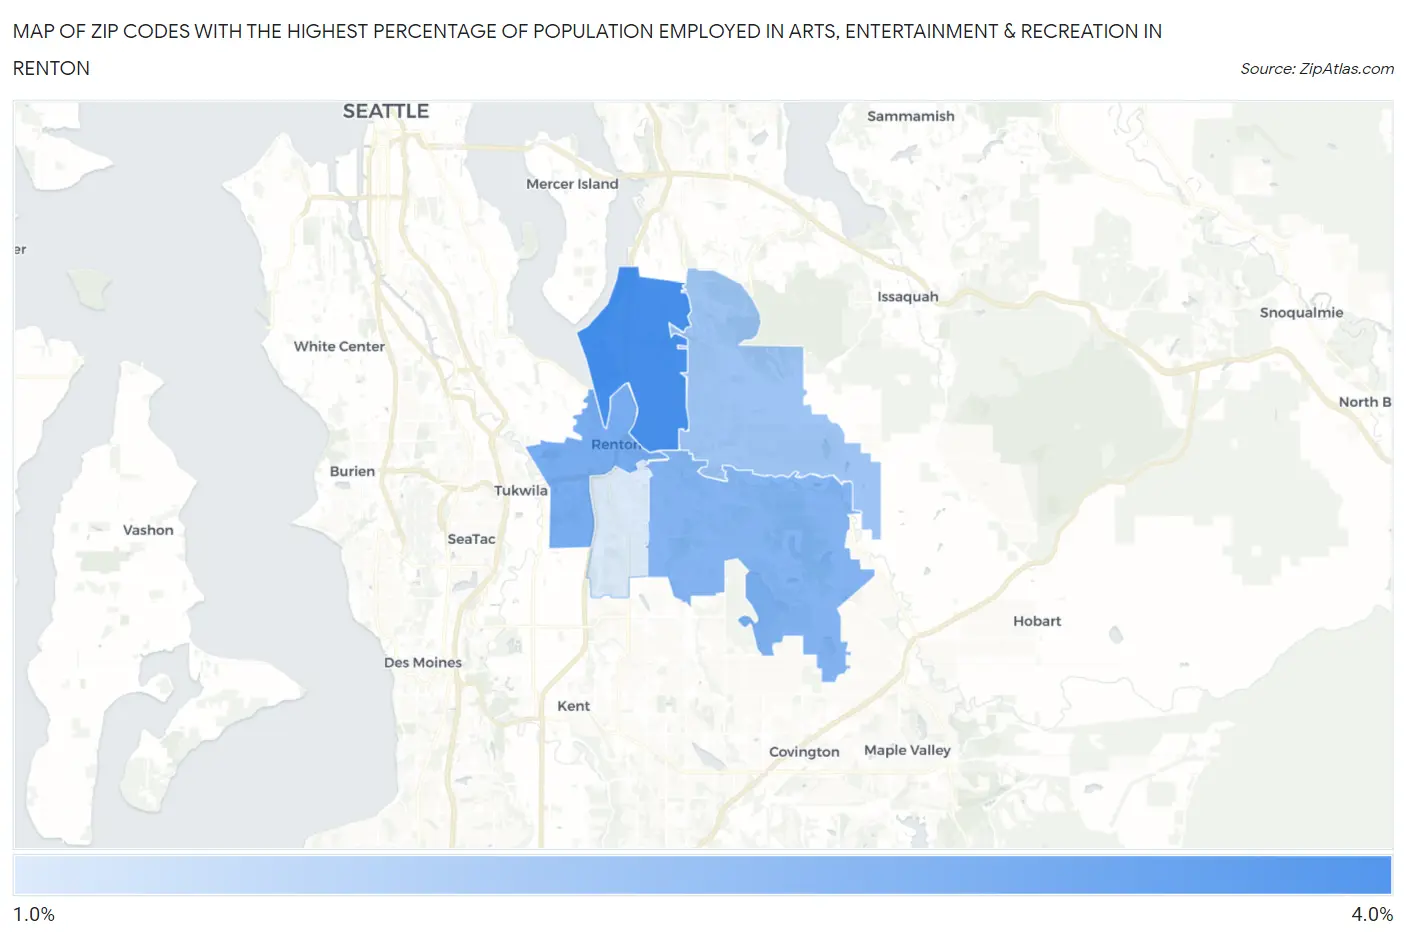
Map of Zip Codes with the Highest Percentage of Population Employed in Arts, Entertainment & Recreation in Renton
1.4%
3.3%
Zip Codes with the Highest Percentage of Population Employed in Arts, Entertainment & Recreation in Renton, WA
| Zip Code | % Employed | vs State | vs National | |
| 1. | 98056 | 3.3% | 2.1%(+1.20)#114 | 2.1%(+1.26)#4,478 |
| 2. | 98057 | 2.7% | 2.1%(+0.551)#160 | 2.1%(+0.615)#6,368 |
| 3. | 98058 | 2.5% | 2.1%(+0.358)#181 | 2.1%(+0.421)#7,154 |
| 4. | 98059 | 2.2% | 2.1%(+0.022)#222 | 2.1%(+0.086)#8,808 |
| 5. | 98055 | 1.4% | 2.1%(-0.781)#330 | 2.1%(-0.717)#14,258 |
1
Common Questions
What are the Top 3 Zip Codes with the Highest Percentage of Population Employed in Arts, Entertainment & Recreation in Renton, WA?
Top 3 Zip Codes with the Highest Percentage of Population Employed in Arts, Entertainment & Recreation in Renton, WA are:
What zip code has the Highest Percentage of Population Employed in Arts, Entertainment & Recreation in Renton, WA?
98056 has the Highest Percentage of Population Employed in Arts, Entertainment & Recreation in Renton, WA with 3.3%.
What is the Percentage of Population Employed in Arts, Entertainment & Recreation in Renton, WA?
Percentage of Population Employed in Arts, Entertainment & Recreation in Renton is 2.8%.
What is the Percentage of Population Employed in Arts, Entertainment & Recreation in Washington?
Percentage of Population Employed in Arts, Entertainment & Recreation in Washington is 2.1%.
What is the Percentage of Population Employed in Arts, Entertainment & Recreation in the United States?
Percentage of Population Employed in Arts, Entertainment & Recreation in the United States is 2.1%.