Zip Codes with the Highest Percentage of Population Employed in Arts, Entertainment & Recreation in Olympia, WA
RELATED REPORTS & OPTIONS
Arts, Entertainment & Recreation
Olympia
Compare Zip Codes
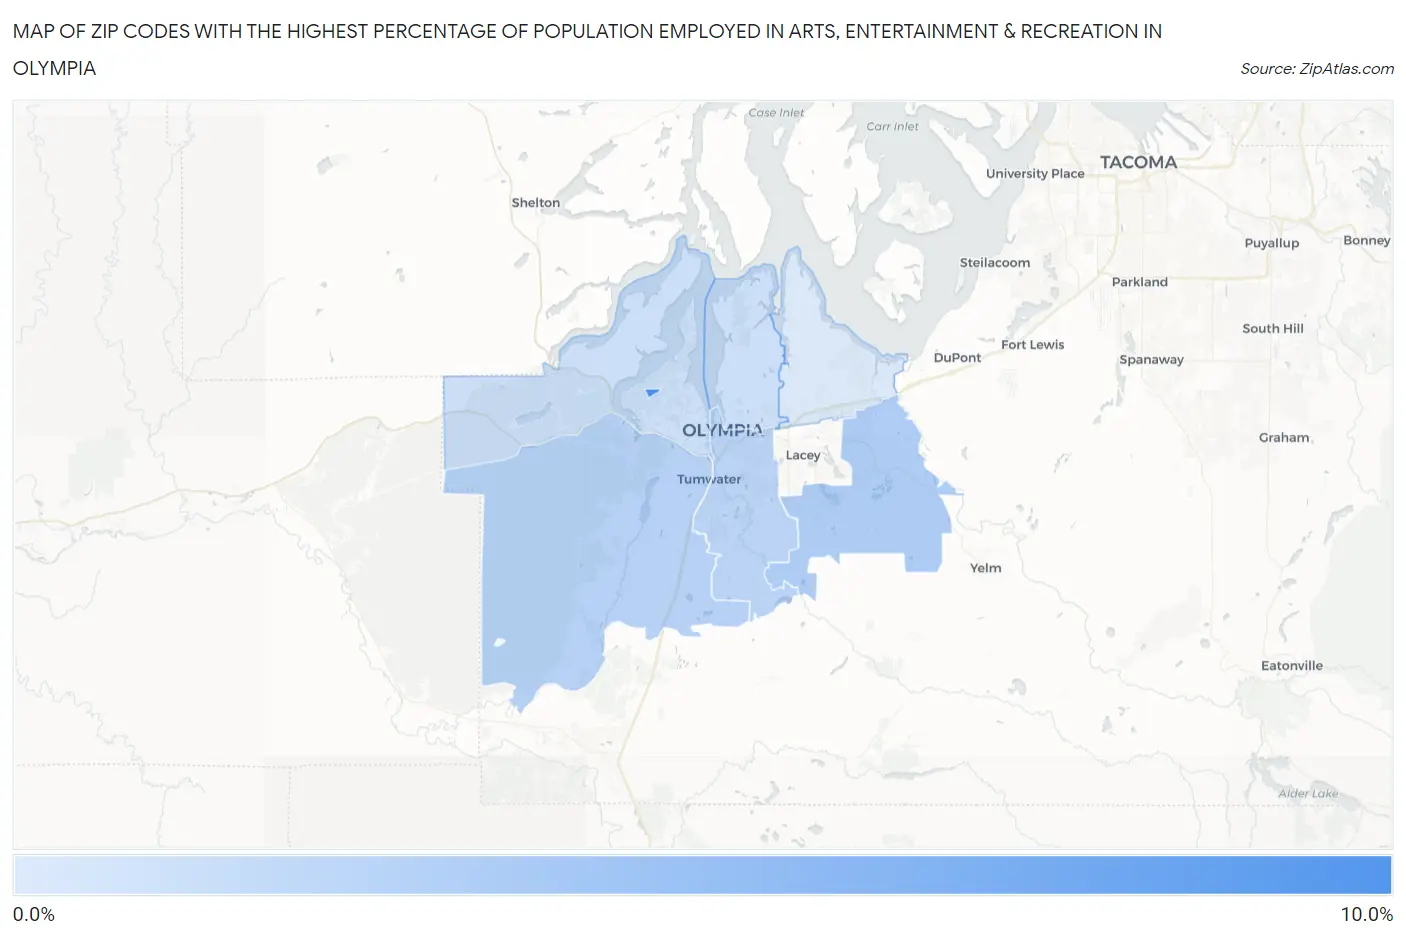
Map of Zip Codes with the Highest Percentage of Population Employed in Arts, Entertainment & Recreation in Olympia
1.3%
9.8%
Zip Codes with the Highest Percentage of Population Employed in Arts, Entertainment & Recreation in Olympia, WA
| Zip Code | % Employed | vs State | vs National | |
| 1. | 98505 | 9.8% | 2.1%(+7.68)#21 | 2.1%(+7.74)#727 |
| 2. | 98513 | 3.8% | 2.1%(+1.63)#89 | 2.1%(+1.69)#3,667 |
| 3. | 98512 | 3.3% | 2.1%(+1.18)#118 | 2.1%(+1.24)#4,523 |
| 4. | 98501 | 3.0% | 2.1%(+0.854)#145 | 2.1%(+0.918)#5,353 |
| 5. | 98506 | 2.0% | 2.1%(-0.111)#237 | 2.1%(-0.047)#9,578 |
| 6. | 98502 | 2.0% | 2.1%(-0.169)#244 | 2.1%(-0.105)#9,907 |
| 7. | 98516 | 1.3% | 2.1%(-0.896)#347 | 2.1%(-0.832)#15,098 |
1
Common Questions
What are the Top 5 Zip Codes with the Highest Percentage of Population Employed in Arts, Entertainment & Recreation in Olympia, WA?
Top 5 Zip Codes with the Highest Percentage of Population Employed in Arts, Entertainment & Recreation in Olympia, WA are:
What zip code has the Highest Percentage of Population Employed in Arts, Entertainment & Recreation in Olympia, WA?
98505 has the Highest Percentage of Population Employed in Arts, Entertainment & Recreation in Olympia, WA with 9.8%.
What is the Percentage of Population Employed in Arts, Entertainment & Recreation in Olympia, WA?
Percentage of Population Employed in Arts, Entertainment & Recreation in Olympia is 2.2%.
What is the Percentage of Population Employed in Arts, Entertainment & Recreation in Washington?
Percentage of Population Employed in Arts, Entertainment & Recreation in Washington is 2.1%.
What is the Percentage of Population Employed in Arts, Entertainment & Recreation in the United States?
Percentage of Population Employed in Arts, Entertainment & Recreation in the United States is 2.1%.