Cities with the Highest Percentage of Population Employed in Arts, Entertainment & Recreation in Oregon
RELATED REPORTS & OPTIONS
Arts, Entertainment & Recreation
Oregon
Compare Cities
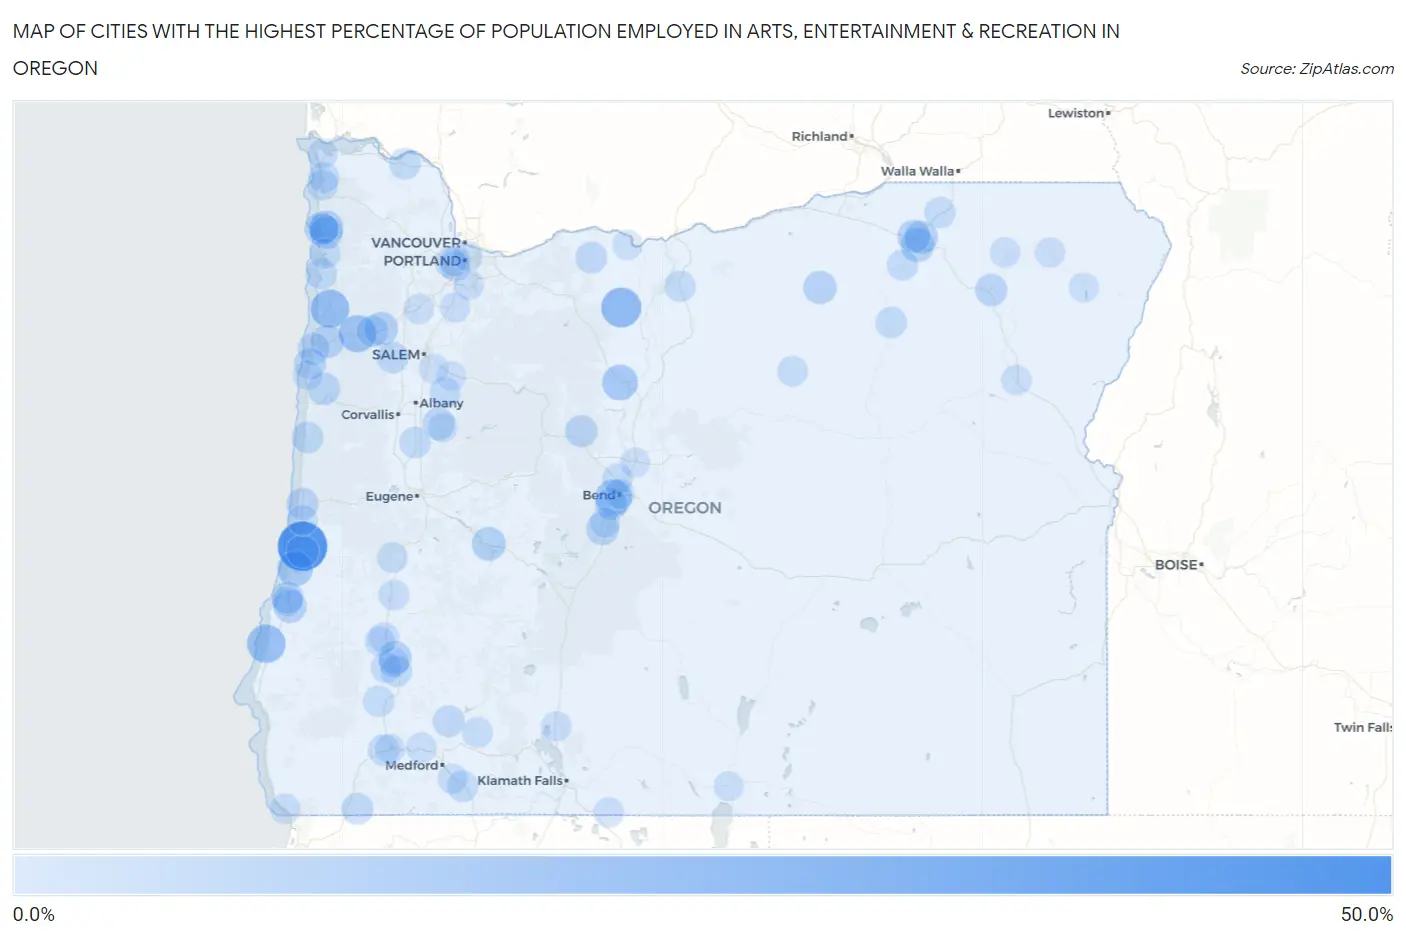
Map of Cities with the Highest Percentage of Population Employed in Arts, Entertainment & Recreation in Oregon
0.0%
50.0%
Cities with the Highest Percentage of Population Employed in Arts, Entertainment & Recreation in Oregon
| City | % Employed | vs State | vs National | |
| 1. | Fort Klamath | 43.8% | 2.1%(+41.7)#1 | 2.1%(+41.7)#57 |
| 2. | Gardiner | 41.2% | 2.1%(+39.1)#2 | 2.1%(+39.1)#67 |
| 3. | Neotsu | 36.9% | 2.1%(+34.8)#3 | 2.1%(+34.8)#84 |
| 4. | Wamic | 21.4% | 2.1%(+19.3)#4 | 2.1%(+19.3)#233 |
| 5. | Hebo | 18.8% | 2.1%(+16.7)#5 | 2.1%(+16.7)#295 |
| 6. | Bandon | 18.6% | 2.1%(+16.6)#6 | 2.1%(+16.6)#302 |
| 7. | Grand Ronde | 16.4% | 2.1%(+14.3)#7 | 2.1%(+14.4)#393 |
| 8. | Tetherow | 14.9% | 2.1%(+12.8)#8 | 2.1%(+12.8)#473 |
| 9. | Bayshore | 13.9% | 2.1%(+11.8)#9 | 2.1%(+11.8)#537 |
| 10. | Warm Springs | 13.4% | 2.1%(+11.3)#10 | 2.1%(+11.3)#567 |
| 11. | Lakeside | 13.0% | 2.1%(+10.9)#11 | 2.1%(+10.9)#598 |
| 12. | Nehalem | 10.2% | 2.1%(+8.06)#12 | 2.1%(+8.07)#883 |
| 13. | Oakridge | 9.9% | 2.1%(+7.80)#13 | 2.1%(+7.81)#931 |
| 14. | Tutuilla | 9.6% | 2.1%(+7.55)#14 | 2.1%(+7.56)#975 |
| 15. | Sheridan | 9.6% | 2.1%(+7.46)#15 | 2.1%(+7.47)#992 |
| 16. | Rose Lodge | 9.0% | 2.1%(+6.86)#16 | 2.1%(+6.87)#1,079 |
| 17. | Bunker Hill | 8.9% | 2.1%(+6.81)#17 | 2.1%(+6.82)#1,086 |
| 18. | Mission | 8.8% | 2.1%(+6.69)#18 | 2.1%(+6.70)#1,111 |
| 19. | Heppner | 8.7% | 2.1%(+6.58)#19 | 2.1%(+6.59)#1,140 |
| 20. | Manzanita | 8.7% | 2.1%(+6.57)#20 | 2.1%(+6.58)#1,142 |
| 21. | Myrtle Creek | 8.5% | 2.1%(+6.38)#21 | 2.1%(+6.40)#1,187 |
| 22. | Gopher Flats | 8.4% | 2.1%(+6.30)#22 | 2.1%(+6.31)#1,200 |
| 23. | Keno | 8.3% | 2.1%(+6.21)#23 | 2.1%(+6.22)#1,224 |
| 24. | Wheeler | 8.3% | 2.1%(+6.19)#24 | 2.1%(+6.20)#1,228 |
| 25. | Falcon Heights | 8.2% | 2.1%(+6.09)#25 | 2.1%(+6.10)#1,250 |
| 26. | Reedsport | 7.8% | 2.1%(+5.69)#26 | 2.1%(+5.71)#1,355 |
| 27. | Three Rivers | 7.5% | 2.1%(+5.45)#27 | 2.1%(+5.46)#1,442 |
| 28. | Seventh Mountain | 7.3% | 2.1%(+5.22)#28 | 2.1%(+5.23)#1,506 |
| 29. | Siletz | 7.2% | 2.1%(+5.14)#29 | 2.1%(+5.15)#1,526 |
| 30. | South Lebanon | 6.9% | 2.1%(+4.82)#30 | 2.1%(+4.83)#1,622 |
| 31. | Island City | 6.9% | 2.1%(+4.77)#31 | 2.1%(+4.78)#1,639 |
| 32. | North Bend | 6.7% | 2.1%(+4.56)#32 | 2.1%(+4.57)#1,707 |
| 33. | Florence | 6.6% | 2.1%(+4.52)#33 | 2.1%(+4.53)#1,722 |
| 34. | Camp Sherman | 6.5% | 2.1%(+4.40)#34 | 2.1%(+4.41)#1,775 |
| 35. | Lincoln City | 6.3% | 2.1%(+4.25)#35 | 2.1%(+4.26)#1,837 |
| 36. | Shady Cove | 6.3% | 2.1%(+4.22)#36 | 2.1%(+4.23)#1,855 |
| 37. | Mount Hood | 6.1% | 2.1%(+4.05)#37 | 2.1%(+4.06)#1,925 |
| 38. | Dallas | 6.0% | 2.1%(+3.92)#38 | 2.1%(+3.93)#1,970 |
| 39. | Willamina | 5.9% | 2.1%(+3.83)#39 | 2.1%(+3.84)#2,019 |
| 40. | Waldport | 5.9% | 2.1%(+3.79)#40 | 2.1%(+3.80)#2,038 |
| 41. | Lincoln Beach | 5.8% | 2.1%(+3.73)#41 | 2.1%(+3.74)#2,078 |
| 42. | Takilma | 5.7% | 2.1%(+3.64)#42 | 2.1%(+3.66)#2,125 |
| 43. | Redwood | 5.5% | 2.1%(+3.41)#43 | 2.1%(+3.42)#2,261 |
| 44. | Ukiah | 5.4% | 2.1%(+3.34)#44 | 2.1%(+3.35)#2,306 |
| 45. | Netarts | 5.4% | 2.1%(+3.28)#45 | 2.1%(+3.29)#2,343 |
| 46. | Clatskanie | 5.4% | 2.1%(+3.26)#46 | 2.1%(+3.27)#2,348 |
| 47. | Canyonville | 5.2% | 2.1%(+3.07)#47 | 2.1%(+3.09)#2,475 |
| 48. | Halsey | 5.1% | 2.1%(+3.03)#48 | 2.1%(+3.04)#2,509 |
| 49. | Grass Valley | 5.0% | 2.1%(+2.91)#49 | 2.1%(+2.92)#2,600 |
| 50. | Glendale | 5.0% | 2.1%(+2.86)#50 | 2.1%(+2.87)#2,638 |
| 51. | Ashland | 4.9% | 2.1%(+2.85)#51 | 2.1%(+2.87)#2,645 |
| 52. | Pilot Rock | 4.9% | 2.1%(+2.76)#52 | 2.1%(+2.77)#2,717 |
| 53. | Athena | 4.8% | 2.1%(+2.69)#53 | 2.1%(+2.70)#2,762 |
| 54. | Seaside | 4.6% | 2.1%(+2.53)#54 | 2.1%(+2.54)#2,886 |
| 55. | Gearhart | 4.5% | 2.1%(+2.39)#55 | 2.1%(+2.40)#3,049 |
| 56. | Scio | 4.5% | 2.1%(+2.37)#56 | 2.1%(+2.38)#3,078 |
| 57. | Tumalo | 4.3% | 2.1%(+2.25)#57 | 2.1%(+2.27)#3,206 |
| 58. | Butte Falls | 4.3% | 2.1%(+2.17)#58 | 2.1%(+2.19)#3,315 |
| 59. | River Road | 4.2% | 2.1%(+2.11)#59 | 2.1%(+2.13)#3,371 |
| 60. | Riddle | 4.2% | 2.1%(+2.11)#60 | 2.1%(+2.12)#3,373 |
| 61. | Coos Bay | 4.1% | 2.1%(+2.02)#61 | 2.1%(+2.03)#3,507 |
| 62. | Cedar Hills | 4.1% | 2.1%(+2.01)#62 | 2.1%(+2.02)#3,519 |
| 63. | Oakland | 4.1% | 2.1%(+1.99)#63 | 2.1%(+2.00)#3,536 |
| 64. | Raleigh Hills | 4.1% | 2.1%(+1.96)#64 | 2.1%(+1.97)#3,574 |
| 65. | Tri City | 4.0% | 2.1%(+1.90)#65 | 2.1%(+1.91)#3,645 |
| 66. | Drain | 4.0% | 2.1%(+1.89)#66 | 2.1%(+1.90)#3,658 |
| 67. | Green | 3.8% | 2.1%(+1.70)#67 | 2.1%(+1.71)#3,916 |
| 68. | Spray | 3.8% | 2.1%(+1.68)#68 | 2.1%(+1.69)#3,937 |
| 69. | Dunes City | 3.7% | 2.1%(+1.64)#69 | 2.1%(+1.65)#4,010 |
| 70. | Garibaldi | 3.7% | 2.1%(+1.61)#70 | 2.1%(+1.62)#4,057 |
| 71. | Harbor | 3.6% | 2.1%(+1.54)#71 | 2.1%(+1.55)#4,156 |
| 72. | Dayton | 3.6% | 2.1%(+1.48)#72 | 2.1%(+1.49)#4,259 |
| 73. | West Haven Sylvan | 3.5% | 2.1%(+1.39)#73 | 2.1%(+1.40)#4,410 |
| 74. | Elgin | 3.4% | 2.1%(+1.35)#74 | 2.1%(+1.37)#4,484 |
| 75. | Malin | 3.4% | 2.1%(+1.31)#75 | 2.1%(+1.32)#4,582 |
| 76. | Gold Hill | 3.4% | 2.1%(+1.27)#76 | 2.1%(+1.28)#4,653 |
| 77. | Baker City | 3.3% | 2.1%(+1.23)#77 | 2.1%(+1.24)#4,732 |
| 78. | Boring | 3.3% | 2.1%(+1.23)#78 | 2.1%(+1.24)#4,734 |
| 79. | San Marine | 3.3% | 2.1%(+1.21)#79 | 2.1%(+1.23)#4,773 |
| 80. | Winston | 3.3% | 2.1%(+1.16)#80 | 2.1%(+1.18)#4,865 |
| 81. | Chiloquin | 3.2% | 2.1%(+1.08)#81 | 2.1%(+1.09)#5,011 |
| 82. | Wallowa | 3.2% | 2.1%(+1.07)#82 | 2.1%(+1.08)#5,031 |
| 83. | Bayside Gardens | 3.2% | 2.1%(+1.06)#83 | 2.1%(+1.08)#5,044 |
| 84. | Sunriver | 3.1% | 2.1%(+1.02)#84 | 2.1%(+1.04)#5,137 |
| 85. | Aurora | 3.1% | 2.1%(+0.993)#85 | 2.1%(+1.00)#5,204 |
| 86. | Talent | 3.1% | 2.1%(+0.990)#86 | 2.1%(+1.00)#5,215 |
| 87. | West Linn | 3.1% | 2.1%(+0.971)#87 | 2.1%(+0.983)#5,259 |
| 88. | Warrenton | 3.0% | 2.1%(+0.880)#88 | 2.1%(+0.892)#5,450 |
| 89. | Stayton | 2.9% | 2.1%(+0.812)#89 | 2.1%(+0.825)#5,607 |
| 90. | Grants Pass | 2.9% | 2.1%(+0.774)#90 | 2.1%(+0.786)#5,715 |
| 91. | Turner | 2.9% | 2.1%(+0.762)#91 | 2.1%(+0.775)#5,738 |
| 92. | Bend | 2.9% | 2.1%(+0.756)#92 | 2.1%(+0.768)#5,774 |
| 93. | Sodaville | 2.8% | 2.1%(+0.722)#93 | 2.1%(+0.734)#5,863 |
| 94. | Heceta Beach | 2.8% | 2.1%(+0.683)#94 | 2.1%(+0.695)#5,960 |
| 95. | Joseph | 2.7% | 2.1%(+0.569)#95 | 2.1%(+0.581)#6,292 |
| 96. | Redmond | 2.7% | 2.1%(+0.569)#96 | 2.1%(+0.581)#6,294 |
| 97. | Chenoweth | 2.7% | 2.1%(+0.568)#97 | 2.1%(+0.581)#6,296 |
| 98. | Depoe Bay | 2.6% | 2.1%(+0.551)#98 | 2.1%(+0.564)#6,349 |
| 99. | Portland | 2.6% | 2.1%(+0.523)#99 | 2.1%(+0.535)#6,439 |
| 100. | Lakeview | 2.6% | 2.1%(+0.520)#100 | 2.1%(+0.532)#6,443 |
Common Questions
What are the Top 10 Cities with the Highest Percentage of Population Employed in Arts, Entertainment & Recreation in Oregon?
Top 10 Cities with the Highest Percentage of Population Employed in Arts, Entertainment & Recreation in Oregon are:
#1
41.2%
#2
21.4%
#3
18.8%
#4
18.6%
#5
16.4%
#6
14.9%
#7
13.4%
#8
13.0%
#9
10.2%
#10
9.9%
What city has the Highest Percentage of Population Employed in Arts, Entertainment & Recreation in Oregon?
Gardiner has the Highest Percentage of Population Employed in Arts, Entertainment & Recreation in Oregon with 41.2%.
What is the Percentage of Population Employed in Arts, Entertainment & Recreation in the State of Oregon?
Percentage of Population Employed in Arts, Entertainment & Recreation in Oregon is 2.1%.
What is the Percentage of Population Employed in Arts, Entertainment & Recreation in the United States?
Percentage of Population Employed in Arts, Entertainment & Recreation in the United States is 2.1%.