Cities with the Highest Percentage of Population Employed in Arts, Entertainment & Recreation in Delaware
RELATED REPORTS & OPTIONS
Arts, Entertainment & Recreation
Delaware
Compare Cities
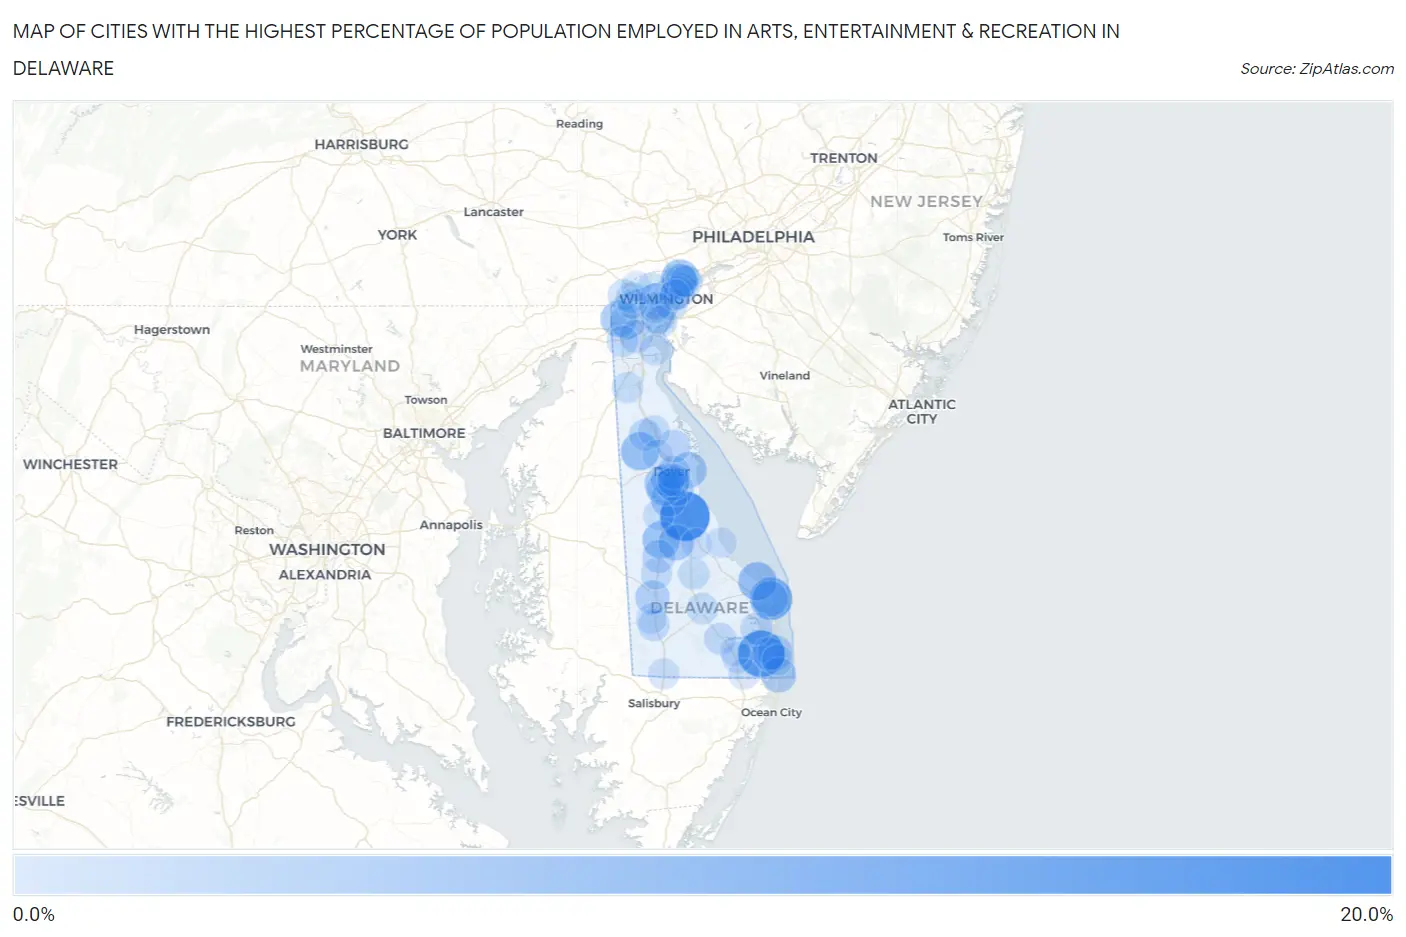
Map of Cities with the Highest Percentage of Population Employed in Arts, Entertainment & Recreation in Delaware
0.0%
20.0%
Cities with the Highest Percentage of Population Employed in Arts, Entertainment & Recreation in Delaware
| City | % Employed | vs State | vs National | |
| 1. | Frederica | 15.1% | 2.0%(+13.1)#1 | 2.1%(+13.0)#461 |
| 2. | Millville | 12.8% | 2.0%(+10.8)#2 | 2.1%(+10.7)#607 |
| 3. | Henlopen Acres | 9.4% | 2.0%(+7.38)#3 | 2.1%(+7.29)#1,021 |
| 4. | Lewes | 6.3% | 2.0%(+4.32)#4 | 2.1%(+4.24)#1,854 |
| 5. | Kenton | 6.0% | 2.0%(+4.03)#5 | 2.1%(+3.94)#1,965 |
| 6. | Arden | 6.0% | 2.0%(+4.02)#6 | 2.1%(+3.94)#1,969 |
| 7. | Harrington | 5.7% | 2.0%(+3.73)#7 | 2.1%(+3.64)#2,131 |
| 8. | Newark | 4.8% | 2.0%(+2.83)#8 | 2.1%(+2.75)#2,733 |
| 9. | Rehoboth Beach | 4.4% | 2.0%(+2.44)#9 | 2.1%(+2.35)#3,118 |
| 10. | Wyoming | 4.4% | 2.0%(+2.42)#10 | 2.1%(+2.34)#3,130 |
| 11. | Little Creek | 4.4% | 2.0%(+2.41)#11 | 2.1%(+2.33)#3,137 |
| 12. | Ardencroft | 4.4% | 2.0%(+2.39)#12 | 2.1%(+2.30)#3,166 |
| 13. | Houston | 4.4% | 2.0%(+2.37)#13 | 2.1%(+2.28)#3,188 |
| 14. | Woodside East | 4.4% | 2.0%(+2.36)#14 | 2.1%(+2.28)#3,190 |
| 15. | Elsmere | 4.4% | 2.0%(+2.36)#15 | 2.1%(+2.28)#3,194 |
| 16. | Bethany Beach | 3.8% | 2.0%(+1.84)#16 | 2.1%(+1.75)#3,850 |
| 17. | Brookside | 3.8% | 2.0%(+1.83)#17 | 2.1%(+1.75)#3,857 |
| 18. | Fenwick Island | 3.7% | 2.0%(+1.74)#18 | 2.1%(+1.66)#3,999 |
| 19. | Rising Sun Lebanon | 3.6% | 2.0%(+1.58)#19 | 2.1%(+1.50)#4,248 |
| 20. | Bridgeville | 3.2% | 2.0%(+1.23)#20 | 2.1%(+1.14)#4,914 |
| 21. | Camden | 3.2% | 2.0%(+1.22)#21 | 2.1%(+1.14)#4,927 |
| 22. | Highland Acres | 2.7% | 2.0%(+0.693)#22 | 2.1%(+0.608)#6,222 |
| 23. | Rodney Village | 2.6% | 2.0%(+0.562)#23 | 2.1%(+0.477)#6,609 |
| 24. | Bellefonte | 2.4% | 2.0%(+0.427)#24 | 2.1%(+0.342)#7,081 |
| 25. | Ocean View | 2.4% | 2.0%(+0.423)#25 | 2.1%(+0.338)#7,097 |
| 26. | Bear | 2.3% | 2.0%(+0.339)#26 | 2.1%(+0.254)#7,367 |
| 27. | Farmington | 2.3% | 2.0%(+0.275)#27 | 2.1%(+0.190)#7,598 |
| 28. | Dover | 2.3% | 2.0%(+0.258)#28 | 2.1%(+0.173)#7,662 |
| 29. | Leipsic | 2.2% | 2.0%(+0.250)#29 | 2.1%(+0.165)#7,696 |
| 30. | Kent Acres | 2.1% | 2.0%(+0.123)#30 | 2.1%(+0.038)#8,203 |
| 31. | Wilmington Manor | 2.1% | 2.0%(+0.071)#31 | 2.1%(-0.014)#8,430 |
| 32. | Wilmington | 1.9% | 2.0%(-0.130)#32 | 2.1%(-0.215)#9,281 |
| 33. | Claymont | 1.7% | 2.0%(-0.299)#33 | 2.1%(-0.384)#10,104 |
| 34. | Clayton | 1.7% | 2.0%(-0.321)#34 | 2.1%(-0.407)#10,227 |
| 35. | Long Neck | 1.7% | 2.0%(-0.336)#35 | 2.1%(-0.421)#10,293 |
| 36. | Blades | 1.5% | 2.0%(-0.462)#36 | 2.1%(-0.547)#10,929 |
| 37. | Greenville | 1.5% | 2.0%(-0.465)#37 | 2.1%(-0.550)#10,939 |
| 38. | Millsboro | 1.5% | 2.0%(-0.479)#38 | 2.1%(-0.565)#11,030 |
| 39. | New Castle | 1.5% | 2.0%(-0.505)#39 | 2.1%(-0.590)#11,168 |
| 40. | Smyrna | 1.4% | 2.0%(-0.599)#40 | 2.1%(-0.684)#11,681 |
| 41. | North Star | 1.4% | 2.0%(-0.637)#41 | 2.1%(-0.722)#11,877 |
| 42. | Newport | 1.3% | 2.0%(-0.704)#42 | 2.1%(-0.789)#12,223 |
| 43. | Glasgow | 1.3% | 2.0%(-0.731)#43 | 2.1%(-0.817)#12,346 |
| 44. | Greenwood | 1.3% | 2.0%(-0.743)#44 | 2.1%(-0.828)#12,400 |
| 45. | Georgetown | 1.2% | 2.0%(-0.838)#45 | 2.1%(-0.923)#12,895 |
| 46. | Ellendale | 1.1% | 2.0%(-0.934)#46 | 2.1%(-1.02)#13,389 |
| 47. | Pike Creek | 1.0% | 2.0%(-0.974)#47 | 2.1%(-1.06)#13,611 |
| 48. | Middletown | 1.0% | 2.0%(-0.975)#48 | 2.1%(-1.06)#13,616 |
| 49. | Ardentown | 1.0% | 2.0%(-0.997)#49 | 2.1%(-1.08)#13,723 |
| 50. | Felton | 0.91% | 2.0%(-1.09)#50 | 2.1%(-1.17)#14,235 |
| 51. | Edgemoor | 0.90% | 2.0%(-1.10)#51 | 2.1%(-1.18)#14,281 |
| 52. | Frankford | 0.85% | 2.0%(-1.15)#52 | 2.1%(-1.24)#14,533 |
| 53. | Delmar | 0.81% | 2.0%(-1.19)#53 | 2.1%(-1.27)#14,725 |
| 54. | Delaware City | 0.78% | 2.0%(-1.22)#54 | 2.1%(-1.30)#14,879 |
| 55. | Seaford | 0.70% | 2.0%(-1.30)#55 | 2.1%(-1.39)#15,291 |
| 56. | South Bethany | 0.69% | 2.0%(-1.30)#56 | 2.1%(-1.39)#15,303 |
| 57. | Cheswold | 0.69% | 2.0%(-1.31)#57 | 2.1%(-1.39)#15,322 |
| 58. | Milford | 0.68% | 2.0%(-1.31)#58 | 2.1%(-1.40)#15,362 |
| 59. | Selbyville | 0.61% | 2.0%(-1.39)#59 | 2.1%(-1.48)#15,792 |
| 60. | Slaughter Beach | 0.57% | 2.0%(-1.42)#60 | 2.1%(-1.51)#15,936 |
| 61. | Hockessin | 0.42% | 2.0%(-1.58)#61 | 2.1%(-1.66)#16,674 |
| 62. | Pike Creek Valley | 0.37% | 2.0%(-1.63)#62 | 2.1%(-1.72)#16,882 |
| 63. | Dagsboro | 0.32% | 2.0%(-1.68)#63 | 2.1%(-1.77)#17,051 |
1
Common Questions
What are the Top 10 Cities with the Highest Percentage of Population Employed in Arts, Entertainment & Recreation in Delaware?
Top 10 Cities with the Highest Percentage of Population Employed in Arts, Entertainment & Recreation in Delaware are:
#1
15.1%
#2
12.8%
#3
9.4%
#4
6.3%
#5
6.0%
#6
6.0%
#7
5.7%
#8
4.8%
#9
4.4%
#10
4.4%
What city has the Highest Percentage of Population Employed in Arts, Entertainment & Recreation in Delaware?
Frederica has the Highest Percentage of Population Employed in Arts, Entertainment & Recreation in Delaware with 15.1%.
What is the Percentage of Population Employed in Arts, Entertainment & Recreation in the State of Delaware?
Percentage of Population Employed in Arts, Entertainment & Recreation in Delaware is 2.0%.
What is the Percentage of Population Employed in Arts, Entertainment & Recreation in the United States?
Percentage of Population Employed in Arts, Entertainment & Recreation in the United States is 2.1%.